Are educational disabilities increasing?
Ofsted’s report on special needs education, published today, wins few points for statistical excellence. It is an opportunity missed.
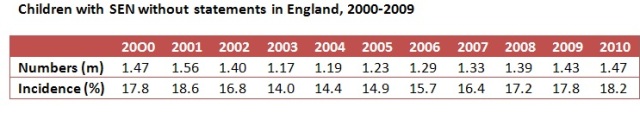
It suggests that the designation of special educational needs (SEN) by teachers is the result of perverse incentives. In some areas, funding depends on the proportion of pupils so defined, encouraging teachers to classify more and more pupils as being in need to win the bounty. Since 2003, while the numbers of severely disadvantaged pupils (those with statements of special education needs) has remained fairly constant, those assessed by their teachers as having SEN but without a statement have risen from 14.0 per cent to 18.2 per cent of all pupils in England.
This rapid increase in incidence may reflect real and growing educational disabilities, but what are the odds it doesn’t? The more pupils classified as SEN, the better the school score on the “contextual value added” league tables that have been in force since 2006. That’s a second perverse incentive.
How would you measure whether either of these incentives is influencing the numbers? First, by comparing growth of SEN pupils in areas that pay schools a bounty against areas that don’t. When two American researchers did that back in 2002 in schools in the District of Columbia, they found that paying bounties roughly doubles the growth in SEN designations.
As for CVA, a first step is to compare the trend in SEN designations before and after it was introduced. Pupils with statements – the more severely disabled - show a decline since 2000, but those whose classification is decided by their teachers show a different trend (Table below).
Incidence rose in the late 1990s (not shown) to a peak in 2001, followed by a decline. Since 2003 there has been an increase, sharper in the years after 2006 when CVA measurement was introduced. The table is not inconsistent with CVA having had an influence, though it proves nothing.
If SEN numbers are being artificially inflated by including pupils with no real disadvantages, then one would expect to find rapidly improving educational results in this group, which is just what the Ofsted report shows. While the proportion of non-SEN pupils getting five or more passes at A*-C grades at GCSE rose by 27 per cent between 2005 and 2009, the rise was 109 per cent in statemented pupils, and 137 per cent in SEN pupils without statements.
They still did much less well than pupils not designated SEN, and the improvement may simply reflect better efforts by teachers to help those with disadvantages. But a simpler explanation is that many of these children don’t have special needs at all, and are being unfairly labelled by their teachers. An investigation by the TES earlier this year found 48 secondary schools in England claiming that more than half their pupils had SEN.
One example cited by the TES, St Marylebone C of E School in London, had 43 per cent of its pupils categorised as having special educational needs, but nevertheless 81 per cent of the schools’ pupils got five top GCSE results at GCSE, including English and Maths.
Good teaching, or poor ascertainment of SEN? Teachers may say it doesn’t matter - only the results count. But they would be among the first to criticise anything that smacks of stigmatisation. It ought to be possible to provide the teaching without first having to tell children they are in special need, when many of them almost certainly aren’t.
That, at least, is what Ofsted concluded, but it could have made the arguments a lot more crisply with the help of some statistics.

Anonymous (not verified) wrote,
Wed, 15/09/2010 - 20:00
While I broadly agree with the sentiment of this article I am troubled by some of the analysis, arguments and logic which themselves would lose points for statistical excellence.
The phase 'disabilities' is used a few times. No one is saying that all these kids are disabled on any definition. They have been assessed, rightly or wrongly, as having specific extra needs. Juxtaposing the large number of pupils with a phrase which makes people think of severe needs such as 'educationally disabled' could be seen as part of the case that they have been over diagnosed. Not good evidence.
The current code of pratice was introduced at the start of 2002. This changed the way non-statemented SEN was assessed and recorded. It clearly led to a cut in their number, if you want to compare the situation before and after. It may have taken some time to bed in and hence not fully shown up in the (January) 2002 figures. This is a much more likely explanation of the 2002 and 2003 falls and suggests a long term rise in the incidence of non-statemented SEN which was taking place before and after CVA was introduced.
The article also says that kids with SEN but without a statement have been assessed as such by 'their teacher'. This is just misleading. Their are two stages within this category. The less severe one will involve their class teacher and the school's SEN co-ordinator. The more severe one should always involve outside specialists from the local authority and/or elsewhere. There is still some scope for playing the system, but it would not be as straightforward as the article suggests.
So what if 48 secondary schools in England (1.5%) have more than half their pupils labelled as SEN, is that too high? Compared to what? On its own that is not meaningful evidence
The use of relative increases in the performance data is not helpful, absolute percentage point increases or the actual values would provide a better guide. In addition, most underperforming groups have dramatically improved their performance on this measure over the past few years. You would also get a different pattern if you looked at the results including good passes at Maths and English.
Pupils with identified SEN are a very diverse bunch and lumping them together for any analysis is limited when they have very different patterns of attainment and exclusions by type and severity of need. CVA could be much more nuanced about this.
If you look closely at the data you get some really odd patterns of SEN identification across the country. That and other 'smoking gun' evidence could be used to identify where to investigate further, say by expert review of a sample of assessments in a particular school or LEA.
Anonymous (not verified) wrote,
Wed, 22/09/2010 - 09:48
What are the statistics for private and public sectors when it comes to the hiring of SEN teachers? It seems that because of the stability of the public sector there is a much higher chance that more special educational needs teachers would go into teaching in that sector. But, is this fact?