Claim and counter-claim over pub closures
Few sights are more dispiriting than a boarded-up pub. Even the gloomiest boozer has the possibility of redemption, given a fresh start. Pubs you might hesitate to enter are havens for the kind of people you might hesitate to meet. Like the chapels in Welsh villages, you need at least two within walking distance so there can be one you choose not to visit.
That choice is, however, diminishing. Pubs are closing at a worrying rate, and CAMRA (the Campaign for Real Ale) blames the pubcos, companies that own a lot of pubs and set the terms and conditions for their tenants. CAMRA says that the greedy pubcos are strangling the life out of pubs, driving them into insolvency by enforcing the “beer tie” whereby tenants pay more for beer and other drinks in return for lower rent.
When it published its Good Beer Guide 2012 in September this year, CAMRA said nine “tied” pubs are closing every week, compared to five pubs that are free of the tie.
But the Government disagrees. In its response to the Business, Innovation and Skills Select Committee report on the pubcos, published last Thursday, the Government said it could see little evidence that tied pubs were more likely to close, contradicting CAMRA’s claims. The committee had called for statutory intervention on the beer tie, but the Government said no. Pubcos’ share prices rose on the news.
Who’s right? CAMRA calculates its figures from the net changes in the number of pubs in each category. But what CAMRA is missing, says the British Beer and Pub Association, is that there are transfers between these two categories: quite a lot of pubs that disappear from the tied sector have not closed but have been sold into the free-of-tie sector.
Both sides, and the Government, rely on the same data, originating from the trade research consultancy CGA Strategy. So how do they get such different answers?
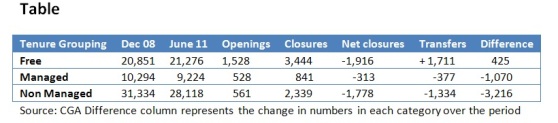
CGA finds that between December 2008 and June 2011, 3,444 free houses closed while among pubs it classifies as non-managed (the sector to which the beer tie applies) 2,339 closed. (The third category, managed pubs, contains those are those that are run by regional breweries or pubcos by installing managers rather than negotiating a lease.)
On the face of these figures, CAMRA is wrong and the BBPA right. The closure rate was almost twice as high among free houses as among non-managed pubs. So there’s no evidence here that the beer tie cripples pubs: on the contrary, those with the tie seem to do marginally better in a chilly environment than free houses which can buy their beer from anybody.
But that’s a limited way of looking at the evidence. If instead of looking at closures we look instead at the numbers of pubs operating in the different categories, a different picture emerges. Between December 2008 and June 2011, the numbers of free houses has actually risen by 425, while the number of non-managed (tied) pubs has declined by 3,216. The figures are in the Table.
How do we reconcile these figures? By including openings as well as closures, and also transfers from one sector to another.
When openings as well as closures are included, the net closures of free houses falls from 3,444 to 1,916, and the net closures of tied pubs from 2,339 to 1,778. There are more pubs in the tied sector, so as a proportion of the December 2008 figure the number of free houses has fallen by 9.2 per cent, and the number of tied houses by 5.7 per cent. On this basis, CAMRA is still wrong.
However, in the most recent period, the first half of 2011, net closures have been higher in the tied sector than the free sector, as the Government response to the Select Committee report makes clear. Over that period, the net closure rate for tied pubs is 0.9 per cent, for free houses 0.6 per cent. So for this period, CAMRA can be said to be right.
Finally, there is the issue of transfers. The free house sector has gained 1,711 pubs over the period by transfers from the managed sector (377) and the tied sector (1,334). So both breweries and pubcos have disposed of some pubs that have become free houses.
The paradoxical conclusion is that despite 1,916 net closures over the period, there were 425 more free houses at the end than at the beginning. (The numbers don’t quite add up, CGA explains, because its counting methods have changed during the period.) Over the same period, tied houses declined by 3,218, made up of 1,778 closures and 1,334 transfers.
On this basis, CAMRA is right. Free houses have increased their numbers while tied houses have declined. But that doesn’t tell us anything about the financial health of either sector.
The pubcos will not have sold off their most successful pubs, and nor will the breweries. Such transfers are more likely to be pubs that are struggling. So these figures are not an index of financial health. Landlords who have taken them over may not be affected by the beer tie, but may well have difficulties with mortgages and debt.
The GGA data for 2009 also shows that local/community pubs were the likeliest to close, with 53 a week closing in the first half of 2009 and 25 a week in the second half. Pubs focussing on drink were more likely to close than those focussing on food. The data gathered available on the BBPA website for 2010 and the first half of 2011 classify pubs differently so it is impossible to say if this trend has continued. Net closures continue, but at a slower rate.
My conclusion, based on the CGA data, is that the beer tie cannot be blamed for the closure of pubs in general. Traditional local pubs relying on drink rather than food struggle to survive whatever sector of the industry they occupy. The answer, according to a survey by Molson Coors reported in the December issue of CAMRA’s newspaper What’s Brewing, is to focus on products that cannot easily be found in a local supermarket – and that includes cask ales, long championed by CAMRA. Good food is clearly another option, but true pub-lovers don’t want to see every pub turned into a gastropub.
Conflict of interest: Nigel Hawkes is a member of CAMRA

Eric Crampton (not verified) wrote,
Thu, 01/12/2011 - 01:15
I'd love similar analysis on the effects of smoking bans. Tough to get a baseline for any difference-in-difference though, alas.