Delving deeper into a decade of drug-related deaths
Today, we begin a series of six articles for Straight Statistics that tell it straight on a decade of drug-related deaths (DRDs).
The first asks: which illegal drugs caused most deaths and for whom? Next, in Part 2, we delve deeper to consider how trends in specific-DRDs changed over time, that is: in 1998-2000 and 2001-2003 (3-year eras) versus in 2004-2007 (4-year era). And, we look at whether the toxicology report cited the co-presence of alcohol.
But surely we must know all this already? Don’t Ministers, parliament and the Advisory Council on the Misuse of Drugs (ACMD) regularly review such data on a regular basis? After all, the World Health Organisation ranks DRDs as a leading cause of life-years lost for young people.
The shaming answer is no. We had to request a detailed cross-tabulation of the demography and toxicology for the 15,795 drug-related deaths registered in England and Wales from 1998 to 2007 to do a proper analysis.
We had the advantage of some expert knowledge of the addictions field, and so were confident that we’d learn a lot – as you almost always do when heading off down a new analysis path. But UK’s Advisory Council on the Misuse of Drugs (ACMD) deserves the credit for sign-posting that path.
As long ago as 2000, when ACMD reported on Reducing Drug Related Deaths, its then chairman, Sir Michael Rawlins, recommended that England and Wales needed suitable counts of its prevalent drug-users to be able to assess the impact of demographic factors (basically sex & age-group) on the risk of cause-specific DRDs.
There are precisely the questions we’ll answer in Part 3 (Double or quits - cocaine’s lethality for male users), Part 4 (Cocaine’s sharply increased lethality for older users), Part 5 (A digression on ecstasy) and Part 6 (Heroin’s hell: twice the risk for males).
Answers are possible because the Home Office paid heed to Sir Michael and added a youth-boost to the British Crime Survey which enables us to track more precisely changes over time in the number of young people who reported past-year use of such illegal drugs as cocaine and ecstasy. In addition, the Home Office commissioned a series of capture-recapture studies to estimate England’s number of injecting drug users.
First, a matter of definitions: The Office for National Statistics kindly provided us with a multi-way cross-tabulation in which each of 15,795 DRDs was cross-classified by era of registration (1998-2000, 2001-2003, 2004-2007), sex, age-group at death (15-24, 25-34, 35+ years), presence/absence of heroin/morphine (hereafter, H), presence/absence of methadone (M), presence/absence of cocaine (C), presence/absence of benzodiazepines (B), and presence/absence of alcohol (A).
We define cause-specific DRDs as DRDs with “one specific illegal drug present and three other specified illegal drugs absent” such as “H, not (M, C, B)” [H-specific] or “M, not (H, C, B)” [M-specific] or “C, not (H, M, B)” [C-specific].
Our second 3-year era was defined to begin at 2001 because, from 2001, the Office for National Statistics coded deaths according to the 10th International Classification of Diseases (ICD10). The same year, 2001, marks a sharp increase in the recorded number of DRDs with ‘any mention of ecstasy’. Are the two related, or is there a more sinister explanation? Find out in Part 5.
Which illegal drugs caused most drug-related deaths, and for whom?
Thirteen is unlucky for some but here are 13 basic facts about the demography and toxicology of a decade of drug-related deaths in England and Wales that are important for press, Parliament, policy-makers and the public to know.
The blue panels of our Table show the following:
- Females accounted for 20 per cent only of the decade’s DRDs (3,205/15,795).
- The majority of female DRDs (57 per cent: 1,818/3,205) occurred to women 35 years old or older.
- In the two younger age-groups, three-fifths of female DRDs were opiate-related (823/1,387; 95 per cent CI: 57 to 62 per cent), that is: heroin or methadone was implicated.
- In the older age group (35+) opiate-related deaths accounted for under two-fifths of female DRDs (667/1,387; CI: 34 to 39 per cent). And so, which non-opiate drugs caused the majority of female DRDs aged 35+ years?
- By contrast, the majority of male DRDs (57 per cent: 7,166/12,590) occurred before the age of 35.
- In the two younger age-groups, over 70 per cent of male DRDs were opiate-related (5,197/7,166; CI: 71 to 74 per cent).
- Even at 35+ years, opiate-related deaths accounted for three-fifths of male DRDs (3,244/5,424; CI: 58 to 61 per cent).
Table Drugs-related deaths registered in England & Wales, 1998-2007: presence/absence of heroin/morphine (H), methadone (M), and cocaine (C).
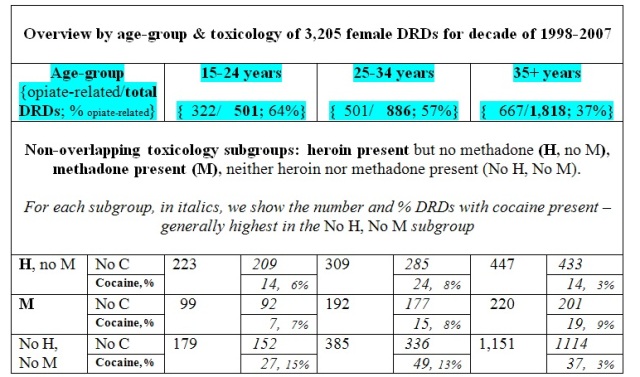
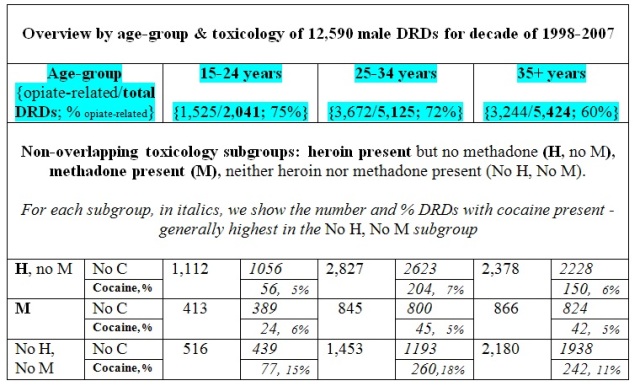
In the lower panels of our Table is further detail about three important, toxicologically non-overlapping subgroups of DRDs. Delving deeper:
- DRDs with heroin present but no methadone (H, no M) increased steadily across the female age-groups, being 223 => 309 => 447, but a completely different pattern applied for males, namely: 1,112 => 2,827 <=2,378. Why?
- There was greater similarity between the sexes in the age-pattern of methadone-related DRDs with roughly twice as many M-related DRDs in each of the two older age-groups as occurred among 15-24 year olds.
- The age-pattern for female non-opiate DRDs (No H, No M) is rather dramatic, being 179 => 385 => => 1,151 {doubled, then trebled}. Are different drugs implicated in non-opiate DRDs in younger women than in those aged 35 or more?
- For males, the increase in non-opiate DRDs between the two younger age-groups is even more striking than for females, but thereafter the rate of increase moderates, as in: 516 => => 1,453 => 2,180. Why are these non-opiate DRD patterns so different between men and women?
- Finally, our Table shows that – with one exception - co-presence of cocaine was roughly doubled for non-opiate DRDs versus for opiate-related DRDs. But its co-presence is far too low to explain most non-opiate DRDs.
- The exception is a reversal of cocaine’s co-presence rates whereby non-opiate DRDs among females aged 35+ years had cocaine’s co-presence recorded at only 3 per cent (37/1,151) but cocaine was recorded at 5 per cent of similarly aged females’ opiate-related DRDs (33/667). Is this cocaine-anomaly some subtle clue to why the age-pattern in non-opiate DRDs is so different between men and women?
We’ve summarised some critical new insights to the joint toxicology and demography of DRDs but also raised a batch of basic questions.
Some we’ll answer provisionally in Part 2 tomorrow when we reveal major changes in the toxicology of male and female DRDs across the 10 years, 1998-2007. These changes alert us to potential gains and losses from how drug-related deaths have been tackled in policy and public health terms in the past decade.
Authors: Sheila M. Bird is at the MRC Biostatistics Unit, CAMBRIDGE CB2 0SR; J.. Roy Robertson, Muirhouse Group Practice, EDINBURGH EH4 4PL; John Strang, King’s College London, National Addiction Centre, LONDON SE5 8AF
Conflicts of interest: SMB serves on, and was inaugural chair of, the Surveys, Design and Statistics Subcommittee (SDSSC) of Home Office’s Scientific Advisory Committee. In 2008, SDSSC reported on 21st Century Drugs and Statistical Science. Authors have research or clinical interests in the epidemiology and prevention of drugs-related deaths. SMB holds GSK shares and MRC-funding as part of the NIQUAD cluster on quantifying drugs harms.

Les King (not verified) wrote,
Fri, 10/12/2010 - 19:14
I notice from ONS that the average age at death in DRD's is about 35 years. This is close to the average age of the population. So if people were to be killed entirely at random, then their average age would also be around 35. Do I conclude that DRD's are therefore random events? I haven't explored the distribution of ages in the general population and DRD's, but is it right that commentators insist that DRD's are mostly associated with young people. Would we say that the population at large is 'mostly young'?
Best Regards
Les King, PhD