Drugs-related deaths: under the influence and over time
Yesterday, we gave 13 key insights into the demography and toxicology of a decade of 15,795 drug-related deaths (DRDs) in England and Wales. But we also posed questions about what underlies different age and sex patterns for opiate-related versus non-opiate DRDs.
Today, we delve deeper - to consider how trends in specific-DRDs changed over time, that is: in 1998-2000 and 2001-2003 (both 3-year eras) versus in 2004-2007 (4-year era). And we also look at whether the toxicology report cited alcohol as co-present.
Before going further, we should remind you about our definitions, acknowledge the Office for National Statistics as the source for the data we analyse, and warn readers that there is no UK standard protocol that forensic pathologists work to when conducting the autopsy for some-one whose death was drugs-related. There is thus some subjectivity in: a) which drugs are tested for at autopsy, and b) in whether their level of presence was judged sufficient to be mentioned on the death certificate.
Our definitions: Each of 15,795 DRDs is cross-classified by era of registration (1998-2000, 2001-2003, 2004-2007), sex, age-group at death (15-24, 25-34, 35+ years), presence/absence of heroin/morphine (hereafter, H), presence/absence of methadone (M), presence/absence of cocaine (C), presence/absence of benzodiazepines (B), and presence/absence of alcohol (A).
We define cause-specific DRDs as DRDs with “one specified illegal drug present and three other specified illegal drugs absent” such as “H, not (M, C, B)” [H-specific] or “M, not (H, C, B)” [M-specific] or “C, not (H, M, B)” [C-specific]. We define as M-related a DRD with any mention of methadone; and similarly for H-related, C-related and B-related DRDs.
Changes in the toxicology of male and female DRDs by era, and whether under the influence of alcohol
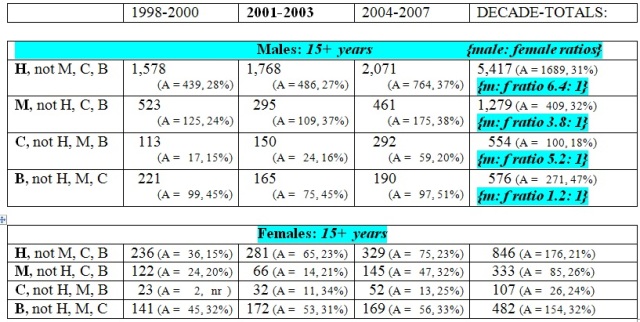
Today, we are focusing on drug-specific DRDs, because they are non-overlapping subgroups of all DRDs and allow us to focus on individual illicit drugs. The upper section (in blue) of our Table accounts for drug-specific DRDs, separately for males and females, but without heed to age-group (see later). The lower panel is for males only, because their DRDs are more numerous, and gives information on drug-specific DRDs by age-group.
During the decade of 1998-2009, there were 6,804 male DRDs with any mention of heroin, 6,317 of which had heroin but not methadone present (H, no M) as we showed yesterday. Of these, 5,417 were H-specific (that is: heroin present but methadone, cocaine and benzodiazepines were all absent). Thus, of 6,804 male DRDs with any heroin present, 5,417 (80 per cent) were H-specific. Of yesterday’s 2,124 male DRDs with any methadone present, 1,279 (60 per cent) were M-specific; and of 1,100 male DRDs with any cocaine present, 554 (50 per cent) were C-specific. {The corresponding percentages for females are quite similar: 78 per cent (846/1,085); 65 per cent (333/511); and 52 per cent (107/206).}
Our data-request to the Office for National Statistics had partitioned the decade into two 3-year eras (1998-2000; 2001-2003) with a final era of 4-years (2004-2007). And so, let’s see how specific DRD patterns look over time.
Heroin-specific DRDs: Males’ H-specific DRDs increased significantly (p < 0.001) between the first and second 3-year era (from 1,578 => 1,768, or 589 per annum) but decreased during the four years of 2004-2007 when 2,071 H-specific DRDs were observed (that is: 518 per annum). {The same phenomenon is observed for females’ H-specific DRDs.}
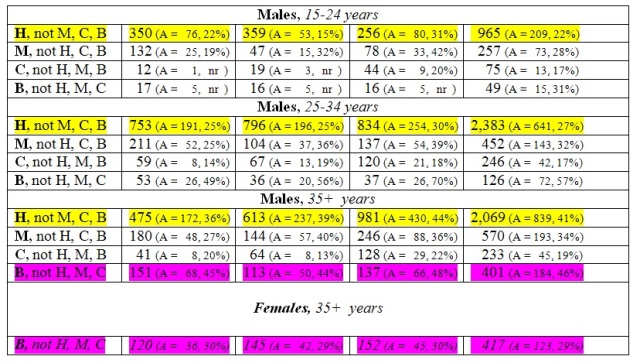
The lower panel for males (see yellow) shows that there is a complex explanation by age-group of the above era-changes. For the two younger age-groups, males’ H-specific DRDs numbered 1,103 in 1998-2000 and 1,155 in 2001-2003 (376 per annum) but decreased dramatically – by 27 per cent - to 1,090 only in the four years of 2004-2007 (273 per annum).
Straight Statistics can claim a first . . . because, for the first time for England and Wales, the dramatic impact on younger H-specific deaths that public health strategies to reduce opiate-related DRDs ought to have had has actually been demonstrated. This level of impact was previously shown for those aged under 35 years in Scotland (where heroin-related deaths predominate) but was overlooked when the Drugs Strategy was reviewed in 2008. Why? For the simple reason that reviewers did not look at H-specific DRDs . . .
However, there is bad news also – just as there was in Scotland. (See Bird SM, Hutchinson SJ, Hay G, King R. Commentary: missing targets on drugs-related deaths, and a Scottish paradox. International Journal of Drug Policy 2010; 21: 155 – 159).
The bad news reflects the ageing of the E&W injector epidemic of the late 1980s so that, for males aged 35+ years, H-specific deaths in England and Wales have steadily increased across the decade: from: 475 (or 158 per annum) => to 613 (204 per annum) => to 981 (245 per annum) in 2004-2007. The critical question now is: when should we expect this epidemic increase to halt?
Table. Specified drug-related deaths (DRDs) by era of registration and, for males, by age-group. Summarised are DRDs with presence of one specific illegal drug and three specified drugs absent. Shown in brackets (A = , %) are the number and percentage with alcohol (A) also present.
Methadone-specific DRDs: Recently Strang et al. (2010) showed that quality-assurance in the prescribing of methadone since 2000 has reduced dramatically methadone-only deaths per 1 million daily doses of prescribed methadone. (See Strang J, Hall W, Hickman M, Bird SM. Impact of supervision of methadone consumption on deaths related to methadone overdose (1993-2008): analyses using OD4 index in England and Scotland. British Medical Journal 2010; 341:640 (pico) and British Medical Journal 2010; 341:c4851 (doi:10.1136/bmj.c4851 for 7 pages).
For both sexes, our Table confirms a marked decrease in M-specific DRDs between 1998-2000 and 2001-2003 but M-specific DRDs show a slight increase in 2004-2007 (from 120 to 152 per annum). Has prescribing become less safe, or have more opiate-users been engaged in substitution therapy? Strang et al. (2010) showed that the second is the predominant explanation.
Aside: In last weekend’s British Medical Journal, Cornish et al. used record linkage to follow-up 5,577 opiate-substitution clients until 1 year after the expiry of the client’s last opiate substitution prescription. They reported that, on treatment, clients’ all-cause mortality rate was 0.7 per 100 person-years (95% CI: 0.5 to 0.9) but very high indeed at 4.5 per 100 person-years (pys) in the first 4 weeks after script-expiry (95% CI: 3.1 to 5.9); thereafter, all-cause mortality reverted to 1.0 per 100 pys in the remainder of the first off-treatment year (95% CI: 0.7 to 1.2).
Even allowing for the fact that death will have been the reason for non-renewal of some scripts, rather than its consequence, these important new data contain a salutary warning: to look out for did-not-attend methadone clients! (See Cornish R, Macleod J, Strang J, Vickerman, P, Hickman M. Risk of death during and after opiate substitution treatment in primary care: prospective observational study in UK General Practice Research Database. British Medical Journal 2010; 341: 928.)
Cocaine-specific DRDs: Cocaine-specific deaths show an epidemic rise across the decade from 136 in 1998-2000 (45 per annum) to 344 in 2004-2007 (86 per annum) which, for males, was evident in all three age-groups. Not before time, the Advisory Council on the Misuse of Drugs is preparing to report on UK’s cocaine epidemic.
Benzodiazepine-specific DRDs: Across the decade, males’ benzodiazepine-specific DRDs (576) were as numerous as their C-specific DRDs (554). The highest recorded co-presence rate for alcohol of 47% is associated with males’ B-specific DRDs.
Another exceptional finding is that the oldest age-group (35+ years) accounts for 70 per cent of males’ B-specific DRDs (401/576) and for an even higher percentage, 87 per cent, of females’ B-specific DRDs (417/482, see pink). Unusual too is the fact that males’ B-specific DRDs are only 20 per cent more numerous than female B-specific DRDs.
There is some good news here, however, because B-specific DRDs show a modest but important decrease over the decade: from 362 (or 121 per annum) => 337 => 359 (or 90 per annum).
Under alcohol’s influence? We have already highlighted that alcohol’s co-presence was recorded most often in respect of B-specific DRDs – indeed, roughly1.5 times as often as for H-specific DRDs. For males, alcohol’s co-presence was 47% at B-specific DRDs versus 31% for H-specific DRDs; and for females was 32% at B-specific DRDs versus 21% for H-specific DRDs. For males, co-presence of alcohol was least likely to be recorded for C-specific DRDs.
Different male: female ratios tell us what? We end by drawing readers’ attention to the fact that there were 6.4 times as many male H-specific DRDs (5,417) as there were female H-specific DRDs (846) but the sex ratio is much less extreme for methadone-specific DRDs (3.8), despite methadone’s being an opiate-substitute. Least extreme of all is the sex ratio of 1.2 for B-specific DRDs. These different sex ratios for drug-specific DRDs cannot be interpreted properly without knowing the sex ratio for prevalent users.
Tomorrow’s article appeals to successive sweeps of the British Crime Survey to estimate past-year use of any cocaine by males versus females, as a start on working out whether the C-specific DRD risk is the same for male versus female users. What do you think the answer is - given that the sex ratio for C-specific DRDs is 5.2: 1? And why are you even having to guess – given that we are more than 10 years into UK’s cocaine epidemic?
Conflicts of interest: SMB serves on, and was inaugural chair of, the Surveys, Design and Statistics Subcommittee (SDSSC) of Home Office’s Scientific Advisory Committee. In 2008, SDSSC reported on 21st Century Drugs and Statistical Science. Authors have research or clinical interests in the epidemiology and prevention of drugs-related deaths. SMB holds GSK shares and MRC-funding as part of the NIQUAD cluster on quantifying drugs harms.
