Good polls, poorly reported
Opinion polls fell thick and fast during the General Election. At times political correspondents appeared to be clinging to them like drowning men to a leaky life raft. Fortunately for them, the polls had a good election, a tendency to exaggerate the likely Liberal Democrat vote being the only quibble.
The Table below, from the British Polling Council, shows the results of the final polls made by companies belonging to the council before voters started filling ballot boxes. The average error column is the average of the difference between the poll result and the actual result across all four estimates.
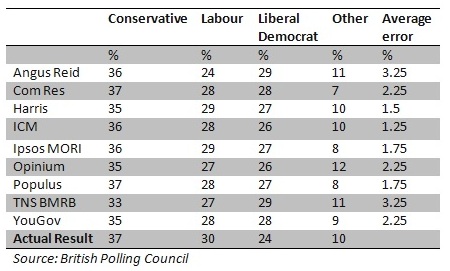
The BPC comments that the tendency at past elections to overstate the Labour vote came to an abrupt end, but every pollster overestimated the Liberal Democrat share of the vote.
Many Conservatives who expected on past experience that their vote would be understated and Labour’s overstated were disappointed by the final result. But the pollsters can be pretty happy: while not as accurate as the 2005 polls, they got it pretty near right.
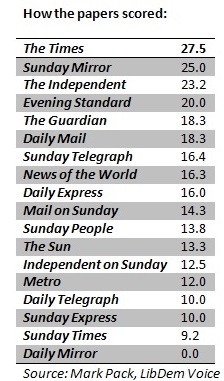
The same can't, alas, be said of how the polls were reported. Given that they made up so great a proportion of the coverage, we might at least expect them to be reported accurately and with the appropriate caveats. Mark Pack of Liberal Democratic Voice ran a useful check by marking the newspapers against a series of criteria originated by the BPC, and creating a league table. The Times came top, The Mirror bottom: the full table is below. The criteria were:
- Has the poll been commissioned from a company that is a member of British Polling Council (BPC)?
- Has the poll followed the BPC’s rules?
- Does the newspaper report give the fieldwork dates for the poll?
- Are the changes in party support from the last poll by the same pollster using the same methodology given?
- Are changes in party support within the margin of error described as such or, where greater significant is attached to them, is other polling evidence presented to justify placing weight on the changes (e.g. three polls in a row from different pollsters all showing Labour support up by two points justifies a conclusion that the one poll wouldn’t)?
Each of these was given five points except the last, which earned ten, giving a total of 30 for each poll published. Any other reporting errors, such as getting the figures wrong in an accompanying graphic, attracted a five point penalty The scores are the average for each media outlet for all the polls it published.
So a perfect score would be 30. The Times comes close, with 27.5, and the Sunday Mirror does respectably, with 25. But the Daily Mirror gets zero. Mr Pack comments: “The Mirror didn’t get much right and then managed to run up enough penalties to get back to zero.”
The criteria listed by the BPC are modest, and newspapers make much of their polls as well as spending handsomely on them. So it is a poor show that most of them can’t do better than this.
