How a decline in drink-driving becomes an increase
A press release from the Association of Chief Police Officers attracted a lot of attention this morning.
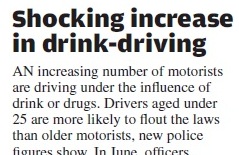
“Number of drink-drivers soars, with almost one in ten under 25s found to be over the limit” said the Mail online. The Independent, The Daily Telegraph, the Western Mail and Metro also picked up the story, with Metro headlining it “Shocking increase in drunk driving” (below).
This was in response to a report showing that the summer blitz on drink and drug-driving carried out by police forces in June had reported a decline in the number of positive drink tests both in all drivers, and in under 25s. (See Tables, below) An increase that’s actually a decrease certainly would be shocking.
What the press release was focussing on, of course, was not the absolute numbers of positive tests, but the rate of positives, which had edged up a bit since last year for both categories. The increases are fairly insignificant if you tabulate the results since 2006, as I have done, but the important issue to focus on is the numbers of tests done.
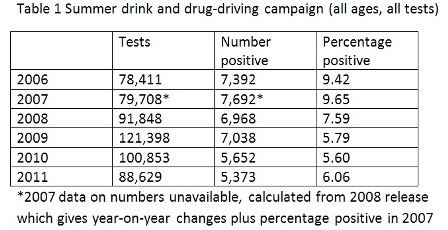
This year there were fewer, 88,629 compared to 100,853 in June 2010. No explanation is given for the numbers varying so much from year to year, but no doubt it depends on the enthusiasm of local police forces and perhaps also on the number of vehicles they see being driven erratically. No regional breakdown is published, and the format of these statistics varies from year to year. It was only through the help of the ACPO press office that I was able to assemble the data in the tables.
In the press release, Chief Constable Phil Gormley, ACPO lead on roads policing, explains the lower number of tests as “targeting the offending drivers more effectively”. But if you target more effectively – by focussing on drivers who are driving especially erratically or have just emerged from bars – you are going to get a higher number of positives. You cannot simultaneously be claiming to target more effectively and to have detected an increase in the rate of drunk driving. If you target more effectively you will inevitably get a higher numbers of positives, without it telling you anything useful about actual changes in the rate of driving under the influence.
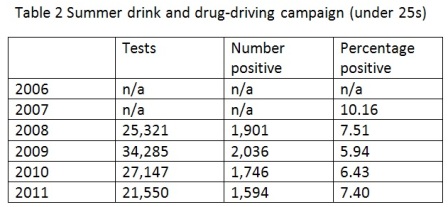
The tables show that that, in general, the more tests are done, the lower the positive rate. They also show that 2011 was nothing remotely out of the ordinary – the rate of positive tests was much higher a few years ago. In the under 25s, the worst year for positive tests (2009, 2,036 positives) was the best year for percentage positive (5.94 per cent).
Does it matter? It’s all in the good cause of cutting drink-driving, so isn’t a bit of statistical juggling permissible for the greater good? Not on this website it’s not. People have enough on their plates without being worried by claims that driving under the influence is “soaring” when the data to justify the claim falls so far short.

Paul Coombes (not verified) wrote,
Wed, 03/08/2011 - 12:11
Surely Chief Constable Phil Gormley's comment that they have been “targeting the offending drivers more effectively”, if true, makes any comparison or extrapolation impossible? This then leaves us in the position where all that can be inferred from the data is that in year a there were b tests of which c were positive which is d percent of the tests. Any other inference is not possible.
Anonymous (not verified) wrote,
Wed, 03/08/2011 - 19:50
Look more at numbers of roads policing officers being reduced if you need an explanation for the decline in tests....