Monitoring hidden deaths from swine flu
How can we monitor deaths from swine flu, in cases where the cause may not be immediately identified? This note suggests how it might be done.
For England & Wales, the table below shows all deaths in 2007 by sex, age-group; and by some specific causes.
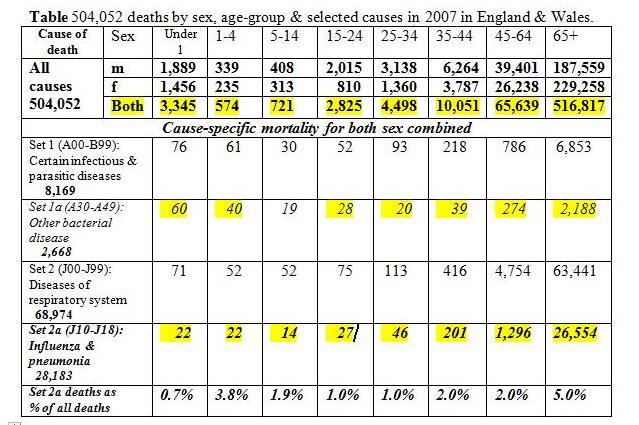
First, any hidden toll of swine flu will be easiest to detect in 1-4 year olds and 5-14 year olds, amongst whom there are typically only around 600 and 700 deaths per annum, or (ignoring seasonality) around 190 and 100 per 17-weeks. In these two age-groups, the expected influenza & pneumonia deaths (my Set 2a) were as few as 22 and 14 in a year, and so, before allowing for seasonal effects, only seven and five would be expected in 17-weeks. As Figure 7 in Health Protection Scotland’s weekly update on swine-flu nicely illustrates, however, we ignore seasonality at our peril!
Second, ordinarily we’d expect only around 1,300 deaths per annum in England and Wales in children aged 1-14 years. Ignoring seasonality, that means fewer than 25 such deaths a week. Therefore, full 10th edition International Classification of Disease (ICD10) coding of any death for a child aged 1-14 years should be done as a matter of national urgency. Although it understandably takes longer to assign ICD10 codes than it does to register deaths, ICD10 coding could, and should, be prioritised for this ‘signal’ 1-14 years age-group. It is not a big task, but a critical one.
Third, sex matters! Of the 274 deaths in 2007 from influenza & pneumonia (my Set 2a) in 15-44 year olds, 117 were females. Thus, whereas Set 2a deaths accounted for 1.4% (157/11, 415) of male deaths at 15-44 years of age in 2007, they accounted for a significantly higher percentage (p < 0.01) of female deaths at 2.0% (117/5,957). Therefore, weekly priority should also be given to an initial sift to check whether any female death at 15-44 years of age might be coded to influenza & pneumonia.
Three questions on what should we look out for
All-cause mortality at 1-4 and 5-14 years: Natural variation is about 10 when Poisson expectation is around 235 and so an additional 30 deaths (from any cause) in 5-14 years olds in England and Wales in the 17-weeks since mid April could be alerting.
Yesterday, Sir Liam Donaldson explained that there had been 44 H1N1-related deaths in England since mid-April 2009, of whom 17% were under 16 years of age – that probably means eight youngsters.
Specific deaths, such as from influenza & pneumonia (set 2a), at 1-4 and 5-14 years: Based on the Table for deaths in England and Wales in 2007, around 20 deaths under 16 years of age might be expected in a 17-week period from influenza & pneumonia . . . before any allowance for seasonality is made. (If anything, seasonality-adjustment would tend to reduce the expected toll for the 17-weeks from mid April 2009.)
If all eight H1N1-related deaths cited by Sir Liam were ICD10-coded as J10-J18, and if they were in addition to conventional-expectation, then by the close of week 32 (on 10 August 2009) there could already be a statistical alert when this year’s deaths in the age-groups 1 - 4 and 5-14 years are compared with their seasonally-adjusted expectations – both for all cause mortality (to identify hidden toll) and for J10-J18 coded deaths (specific toll). Any hidden toll we don't know about until all-cause mortality in rhe past 17 weeks is disclosed for those uner 15 years.
Q1. How many deaths from all causes have there been in the 17-weeks since mid-April 2009 in children aged 1-4 and 5-14 years in England and Wales?
Q2. And how many deaths have there been from influenza & pneumonia among females aged 15-44 years?
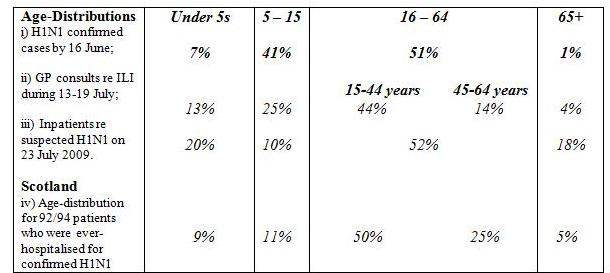
Health Protection Scotland tracks registered deaths from all causes against a seasonally-adjusted daily expectation, for Scotland, of around 160 deaths currently. However, such monitoring could easily miss an H1N1 signal just because total deaths are so dominated, as the Table for England and Wales shows, by deaths in persons aged 65+ years. Senior citizens, however, represented a rather low proportion, for example, of H1N1 confirmed cases by 16 June 2009: see box (below) on age-distributions.
The 5-14 year age-group represented about two-fifths of the initially-confirmed H1N1 cases but a much a lower proportions both of GP consultations about influenza-like-illnesses (ILIs) and of inpatients with suspected H1N1. The trend is reversed, however, for the under 5s, who are a much higher proportion of inpatients with suspected H1N1 than they were of H1N1 cases confirmed by mid-June.
Of course, cause-specific expected deaths by age-group would be put on a firmer footing if based on the past 5 years rather than on 2007 alone; and by invoking seasonal adjustment.
Q3. By age-group, what are the seasonally-adjusted, all-cause and cause-specific expected deaths against which England and Wales is monitoring weekly deaths in 2009 to signal swine-flu’s hidden and specific toll? Monitoring diagrams like Scotland’s Figure 7 (below), which plot-ahead expected deaths in the forthcoming weeks, are needed for England and Wales for its ‘signal’ age-groups, for all-cause mortality, and for deaths from specific-causes.
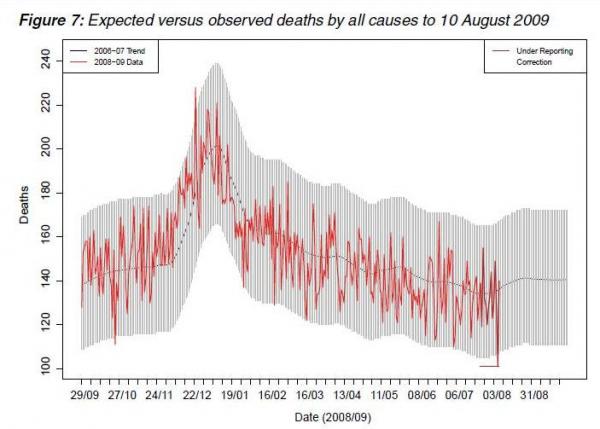
Source: Health Protection Scotland
(Note: this article was corrected on 17 August: disegard the previous version)
