Swine flu - what to look out for
Tomorrow, the Health Protection Agency (HPA) will issue its weekly update on swine-flu in England. What should you look out for - as a member of the public, press, parliament, or as a public health professional?
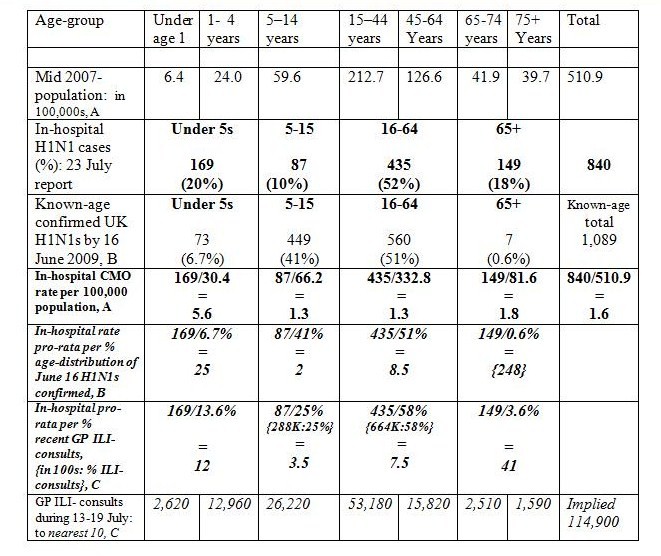
First, look at the trend for in-hospital cases of H1N1. Past weekly-reported data have been: 335 (9 July); 652 (16 July); 840 (23 July); HHHH (30 July). This trend monitors pressure on National Health Service (NHS) staff and facilities in treating the ‘more severe’ consequences of H1N1 infections. Beware that numbers in-hospital confound two distinct features: new H1N1 admissions to hospital and the duration of H1N1-hospitalisations. We expect that both aspects are age-dependent. See Table for the age-distribution of last week’s in-hospital cases.
Second, look out the new data on the trend for in-intensive case unit (in-ICU) cases of H1N1. These data have not yet been published on a regular basis, as far as I know, but this trend is clearly important as it monitors ‘severe-H1N1’ pressure on UK’s ICU beds. We already know that an H1N1-affected pregnant woman in her 20s has been flown from Scotland to Sweden to receive extra-corporeal membrane oxygenation (ECMO) because all five places at UK’s only facility in Leicester were in use. In-ICU cases conflate new ICU admissions with duration of stay in ICUs.
Third, look at the trend in H1N1-related deaths, their demography and whether there were pre-existing other risk-factors. Past weekly-reported data have been: 12 (9 July); 26 (16 July); 26 (23 July); DD (30 July).
Fourth, look out for new information on how the headline ‘estimated number of H1N1 infections in the past week’ was actually calculated. Previously in the mix would have been age-specific population sizes, age-specific GP consultation rates about influenza-like-illness (GP-ILIs), age-specific proportion of GP-ILIs that are actually swine-flu, and age-specific percentage of swine-flu cases who consult their GPrather than other source of healthcare advice. The introduction last week of new phone-lines for H1N1 diagnosis and access to treatment will have changed how patients who suspect that they have swine-flu interact with their general practitioner!
Fifth, look out for information on the daily number (and demography) of new hospital admissions for H1N1, and track how long it takes for the cumulative total to double. Similarly for the daily number of new H1n1-related ICU admissions.
Sixth, compare the age-distributions of those recent or past H1N1 cases with the age-distribution of ‘more severe’ cases of H1N1 as severity is unlikely to apply equally across the ages. Let me illustrate this – thanks to the health correspondent of The Times, David Rose.
After last week’s release and press conference, he kindly gave me a copy of Chief Medical Officer’s (CMO) power-point presentation to journalists on 23 July. It gave new information that HPA had not disclosed on the age-distribution of England’s then 840 in-hospital H1N1 cases. My Table’s mid-year 2007 population and GP-ILI figures are for England.
Whereas the CMO reported prevalent hospitalisations per 100,000 of population, I’ve related them also to the known-age distribution for UK (note; not just England) cases who were H1N1-confirmed by 16 June 2009; and to the age-distribution for GP-ILI consultations in the week of 13-19 July.
‘More severe’ H1N1 (either disease progression or duration of hospitalisation or both) clearly afflicts older-age H1N1 cases, as the indicative B and C in-hospital rates increase beyond those for the H1N1-infected under 5s.

Finally, it might be worth examining whether there is any logical basis for the siting of the Tamiflu collection points. Some primary care trusts have allocated a single point for the anti-viral drug to be picked up, while others have more than 30. How was this decided? And by whom?


Santosh patil (not verified) wrote,
Tue, 01/09/2009 - 12:55
This site is very useful & informative. Special thanks to U, this Article is informative and also good content based on swine flu, which is the most current fear, everyone in minds. I really like this Article and also request to u that please keep it up....
I have some important comment on swine flu which is available on this link http://www.jiyohealthy.com/2009/08/swine-flu-rumors-in-india and also tell your comments
Trey Smith (not verified) wrote,
Fri, 28/01/2011 - 06:25
Thank you for explaining this subject to the public.
http://www.treysmithblog.com Trey Smith