Will benefit cuts cost lives?
As the Treasury sharpens its knife and goes in search of benefit cuts, researchers at Oxford and London have published an interesting analysis of the effects of welfare on mortality.
The Guardian and the BBC reported the findings, The Guardian story leading on the possibility that the cuts might lead to 38,000 more deaths in the next decade. That’s a big number, though a small fraction of total deaths which will be around 5 million over the period.
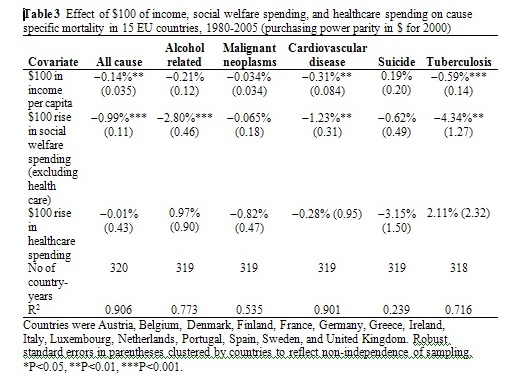
The basic finding, published in BMJ.com, is that every £70 reduction in social welfare spending per person would increase alcohol-related deaths by about 2.8 per cent and cardiovascular mortality by 1.2 per cent. The authors point out that while healthcare spending has been protected by the Government, social security spending has not.
The method used by David Stuckler from Oxford and Sanjay Basu and Martin McKee from the London School of Hygiene and Tropical Medicine was to compare social spending and mortality in EU countries. Their Figure 1 (below) “shows a clear association between social welfare spending and mortality in 2000 across EU countries” they say, though to my eye it doesn’t.
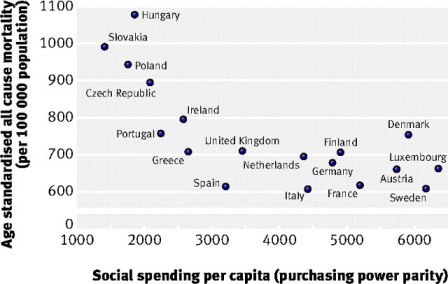
What it shows is a high mortality in four recent recruits to the EC (Hungary, Slovakia, Poland and the Czech Republic) countries recently emerged from Communism, and much lower mortality among another 14. In this group, there is no obvious link between social spending and mortality: Denmark spent almost $6,000 a head in 2000, but had higher mortality than the UK ($3.500 a head). Spain’s spending was low but so was its mortality; it spent about half as much as Sweden to achieve the same results.
Figure 2 (below) is more persuasive. In this graph, each point represents a single value for each of 15 EU countries (excluding the recent entrants) in which mortality is plotted against social welfare spending for a single year. Welfare spending is plotted as the deviation from country average measured in US dollars, at the 2000 value of the dollar.
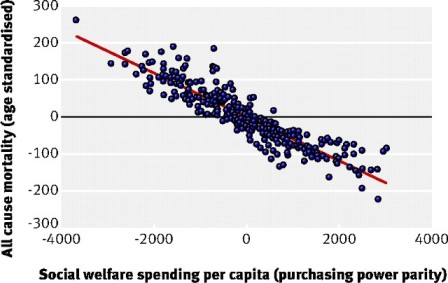
As spending has increased in real terms over the 25 years covered, the points at the left of the graph must represent earlier years, those on the right more recent years. So this graph roughly represents the passage of time: high mortality falling as spending rises. I thought it would be interesting to see the same data plotted for the UK alone, and the authors were kind enough to produce such a graph, below.
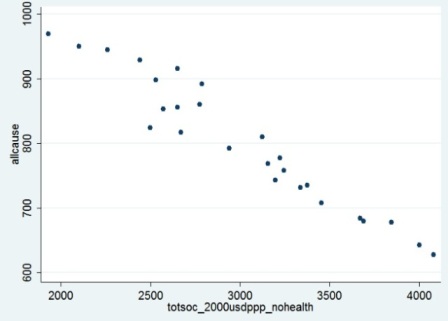
This shows a correlation between social spending and mortality, but so would a plot of GDP, income per capita, or total Government spending. As countries become richer, mortality falls. The issue is the slope of the graph, and the claim made is that for welfare spending the slope is greater than for GDP, or health spending, or Government spending in toto. The authors say that the slope is seven times greater for welfare spending than GDP – that is, a comparable rise in welfare spending is associated with a sevenfold greater reduction in mortality than a similar magnitude rise in GDP (0.80 per cent vs 0.11 per cent).
The claim that welfare spending is linked to mortality is certainly credible. Better housing and less poverty would be expected to have an effect on people’s health. More striking, though not surprising to students of health inequalities, is the claim that social spending trumps health spending as a way of reducing mortality. The table below from the paper summarises the findings.
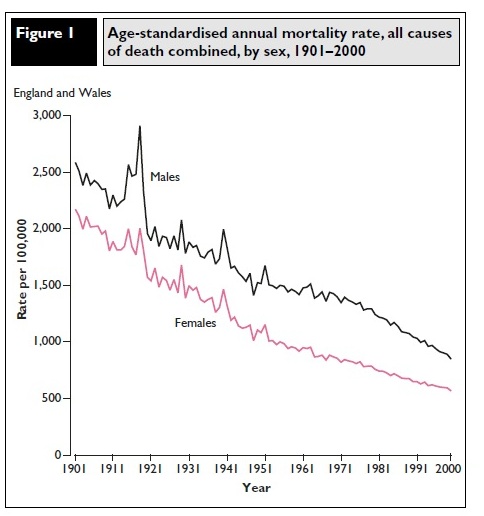
Several things strike me. First, it is largely concerned with declines in mortality that are correlated with increases in welfare spending. Even if we agree with the authors that this correlation does represent causation, it does not necessarily imply that the opposite will also prove true: that falls in spending will cause rises in mortality. The trend in mortality in the 1980s, for example (below) does not show any evidence of the welfare cuts made by the Thatcher Government . They seem to have had no perceptible effect, though a more detailed examination might detect one.
Second, it’s odd that if social spending prevents deaths, mortality has fallen as fast if not faster in non-recipients than in recipients. Gaps in life expectancy between rich and poor have widened over recent years in which welfare spending has risen fast. It’s possible the gaps would have increased more rapidly still in the absence of welfare spending, but given that the authors claim welfare is seven times as effective as wealth in cutting mortality, that doesn’t sound entirely plausible.
Third, a minor point. The fact that increased health spending increased mortality from alcohol-related illnesses and tuberculosis (see table) will be a disappointment to many doctors. Granted, the increase in these cases is not statistically significant, and could be due to better ascertainment. The more doctors, the more disease.
My final question is over the way the comparison is made. Income increases of $100 a head cannot be compared directly to social spending increases of $100 per head. Social security absorbs about 12 per cent of national income, so to generate $100 per head of social service spending requires $850 a head in national income.
By this reckoning, $100 per head of social security spending should be compared to $850 per head of income. And the mortality attributable to an additional $850 a head, according to the table above, would produce a 0.14 x 8.5 = 1.19 per cent drop in mortality. So the income needed to generate a mortality drop of 0.99 per cent through social services spending would actually generate a greater drop through increased wealth.

Anonymous (not verified) wrote,
Thu, 22/07/2010 - 08:01
The german government will cut social welfares, and so punish the people who became unemployed because of the crisis. Instead of this, the greedy bankers and gamblers should finally be forced to pay for the mess they have caused ! Our opinion here:
http://www.youtube.com/watch?v=qCYRxHz-OY0&feature=channel