A close look at LibDem claims on pensioner poverty
Pensioners are a favourite group at election-time, some might say for cynical reasons. Older people are reliable voters, and their welfare is an important index of a society’s commitment to caring for those less able to care for themselves. No surprise, then, that politicians have more to say about the elderly during elections than they do at other times.
The Liberal Democrats claim that 2.5 million pensioners are living below the breadline, calling it a scandal. Although it is certainly possible to cite official statistics in support of this figure, on its own it doesn’t give a clear picture of poverty among pensioners.
Statistics on poverty in the UK come primarily from the Office of National Statistics’ Households Below Average Income (HBAI) series. HBAI uses net household disposable income as a measure of the living standards of individuals. Income is equivalised (adjusted) according to the number and characteristics of the people comprising a household. By using equivalisation, the incomes of a household can be taken as a whole and, in a sense, weighted to give each member of the household a net income which can be compared fairly across a population.
Net household disposable income is the total earnings for a household minus income tax, national insurance, council tax and certain other outgoings, and plus any social security benefits received (such as child tax credits), investment profits, private pension returns and some other sources of income.
The ONS releases two headline figures in its HBAI reports. One is the number of people in households with “below 60 per cent of contemporary median net disposable household income before housing costs (BHC)”. The other is the number of “households below 60 per cent of the contemporary median net disposable income after housing costs (AHC)” (my emphasis).
Of these two measures, the 2.5 million figure used by the Lib Dems is obtained from pensioners with an income below 60 per cent of the median before housing costs in 2007-08.
The alternative figure for pensioners after housing costs is less, only 2 million. So when the cost of housing is deducted from net disposable income, half a million pensioners are no longer considered to be “below the breadline” when compared to the national average.
The 60 per cent of median equivalised household income is the accepted measure, both by OECD and by the EU. But there has been a long-standing and extremely involved debate about whether HBAI should use BHC or AHC net disposable income. This dispute is unresolved, so both figures are still being published.
In the case of pensioners - and maybe others, too – my instinct is that the AHC figure should be used. Why? Because everybody has to live somewhere, and housing costs vary hugely. For pensioners, unlike younger people, these costs account on average for a smaller proportion of total income. While including housing costs draws more people of most age groups into poverty, in the case of pensioners the opposite is true
If housing costs aren’t deducted from net income, the living standards of certain households might be overstated because they could live in areas such as London where the cost of housing is high. Conversely, some households might actually be enjoying a higher standard of living by paying more for their housing yet appear to be less well-off if their incomes are counted after housing costs.
Looking at long-term statistics, the value of income growth might also be understated by using AHC measures. If households start to earn more and therefore pay for better accommodation, they could have increased their standard of living while remaining poor as measured by AHC. But using BHC measures could overstate the net incomes of low-income families, whose income might seem to increase if housing benefits increase to meet a rise in rent, when the actual disposable income hasn’t increased at all.
So there are arguments on both sides of the question. But there is generally a correlation between changes in BHC and AHC incomes. It is also generally the case that the number of people in relative poverty is greater using AHC figures than using BHC figures.
For children in 2007-08, 2.9 million were living on a net household income below the breadline. This rose to 4.0 million when housing costs were deducted. Similarly, for people of working age in 2007-08, 5.6 million were living below the breadline measured BHC. That figure became 7.5 million AHC.
So why is the trend the opposite for pensioners? The reduction in the number of pensioners below the breadline AHC (by 500,000) must partly be related to the lower costs of their housing.
Pensioners have often paid off their mortgages so are left with more disposable income after paying housing costs. In 2007-8, 72 per cent of the pensioner cohort owned their homes outright compared to just 21 per cent of adults of working age.
Does it make much difference to the LibDem argument? Two million pensioners living in poverty is a major problem. But it does look as if the 2.5 million figure was used deliberately to overstate the case. Although there is debate over whether BHC and AHC measures should be used, in the case of the pensioner group at least AHC seems to capture the issue better.
Since the Liberal Democrats have been using this figure loudly as a campaign tool, it may also be useful to look at some of the long term statistics for pensioners living below the breadline. The table shows the percentage of pensioners with an equivalised income 60 per cent below the contemporary median net household income:
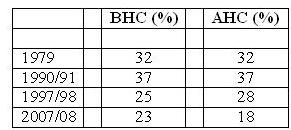
According to the AHC measures, there are considerably fewer pensioners now in relative poverty than in 1997 when the Labour government took office, and substantially fewer than in 1990 at the beginning of the Major government. But in a comparison based on BHC measures, it seems that Labour has made only very small improvements.
Any measure of poverty and inequality has its imperfections. The OECD scales used for equivalisation in the HBAI analysis also weight all “adults” the same. This does not necessarily take account of the different (and possibly more expensive) needs of the older population.
Equally, a large proportion (63 per cent) of pensioner households consist of single women. Therefore, the economy of scale in households that the OECD tries to equivalise may not apply – and as a result, the effects of relatively low income might not be fully accounted for.
That said, a single statistic about pensioners in poverty, as used by the Liberal Democrats, cannot give the full picture. The way the claim is phrased is one of its problems. By describing a measure of relative poverty as “the breadline”, the claim becomes more emotive than statistical, conjuring images of extreme poverty and the very harshest conditions. While the HBAI measure of 60 per cent of the median net household income is extremely important in showing just how work needs to be done to tackle poverty, it must also be used sensitively.

Tim Jones (not verified) wrote,
Tue, 04/05/2010 - 09:45
Out of interest, do the statistics take account of the fact that a number of pensioners (I have no idea how many) have a pot of savings and own their own houses? You might be very well off or, at least, well above the "breadline" by eating into capital and downsizing as and when appropriate. Doesn't looking only at income gives a misleading figure for "poverty".
Aren't we being told that wealth is more and more in the hands of older people? Surely that should be factored in somehow..?
Letitia Jarvis (not verified) wrote,
Fri, 17/06/2011 - 17:45
The figures that are being given for pensioners living in poverty are untrue. David Cameron and Nick Clegg should be hanging their heads in shame, and so should the people who give false figures regarding how the real state of poverty in this country. I feel ashamed to say l am British and live in one of the richest countries in the world. This is the twenty first century and we still have an ever widening gap between the rich and poor.