Road casualty statistics: up a cul-de-sac
How many people are seriously injured on Britain’s roads every year? It sounds a simple question, but it certainly doesn’t have a simple answer.
Yesterday the Select Committee on Transport of the House of Commons quizzed Richard Aldritt, Head of Assessment at the UK Statistics Authority, about the discrepancies between figures collected in different ways.
First, there are the figures of the numbers “killed or seriously injured in accidents reported to the police” which are used to see if the Department for Transport is meeting its targets. These are going down quite nicely, and the target (a 40 per cent reduction by 2010 against a baseline which is the average for 1994-98) is in line to be met.
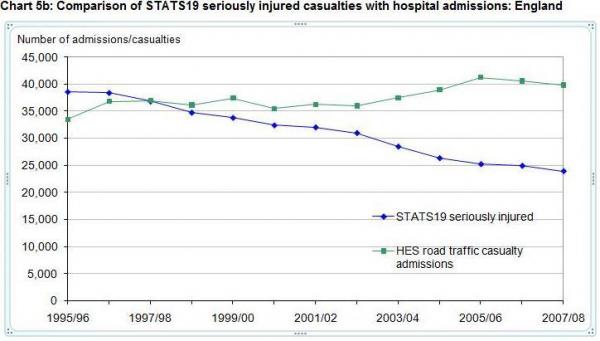
The actual figures, collected in the data series called STATS19, are shown below. They have come down from just under 40,000 in 1995-96 to 26,000 in 2007-08. But note that hospital admissions for road traffic casualties, collected from Hospital Episode Statistics, show no such decline. As Helen Joyce reported earlier on Straight Statistics, the discrepancy between these two sets of data needs explaining.

In addition, in the STATS19 series, injuries have fallen faster than deaths – by 41 per cent compared to 29 per cent. Deaths are reliably recorded, with very few missed. So either the two trends are diverging, with the ratio of deaths to serious injuries changing, or some serious injuries are not being recorded as such.
A second set of figures comes from the National Travel Survey, which since 2007 has asked a sample of people if they have suffered an injury in a road accident. This suggests that in 2007-08, 1.8 per cent of all adults suffered an injury of some sort. However, the STATS19 figures indicate that only 0.4 per cent did. So if the NTS is right, STATS19 is picking up only about a quarter of all injuries.
For serious injuries, STATS19 produces a figure of 26,000 for 2007-08, but the NTS a figure of 220,000 – eight and a half times greater. “Is this not a very dramatic difference?” asked the committee chairman, Louise Ellman MP. Mr Aldritt agreed.
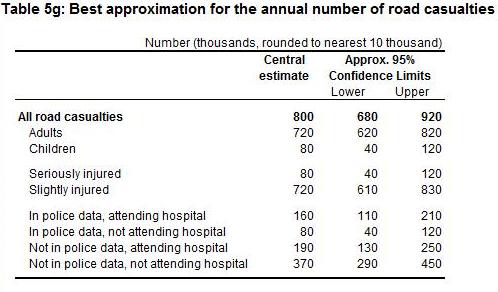
Faced with this huge discrepancy, Matthew Tranter, a DfT statistician, makes a heroic guess at the actual numbers (below) and comes up with a “best approximation” for the annual number of road casualties for the UK of 800,000, to the nearest 10,000, and of serious injuries of 80,000 - but it could be as few as 40,000 or as many as 120,000. That’s a pretty wide range, for something that it ought to be possible to count with reasonable precision. (His detailed analysis of the figures, in section 5 of the report, is well worth reading.)

It’s also some way from the STATS19 figure of 26,034 serious injuries against which success in the target is measured. But Mr Aldritt refused to be drawn on whether this meant the department hadn’t met its target. Because the target was clearly defined as “those killed or injured in accidents reported to the police”, then only STATS19 data applies. (Whether accidents reported to the police are identical to accidents recorded by the police is not entirely clear but if there is a difference – and Mr Aldritt conceded there may be – nobody knows how to measure it.)
The figures are the responsibility of the department, not of the Statistics Authority, he made clear. The authority has already made plain it expects improvements. “So has the Government met its target?” Mrs Ellman insisted. “Yes, as crafted” said Mr Aldritt. “Because it is couched in those terms, it is the target.”
Among the changes the authority sought were changing the name from “reported casualties” to “police-recorded casualties” to make it clear what the source actually is. The department prefers “reported road casualties” which Mr Aldritt said he could live with.
“There is no evidence that the department is doing anything wrong” he said. “STATS19 data is a very powerful source, and a good job is being done, within its limitations.” He added that the National Travel Survey had been a very important step, but questioned whether the sample size was sufficient to meet a wide range of needs.
The suspicion remains that STATS19, the police-reported data, has been the victim of targetitis, and changing policing methods. With fewer police on the roads, some accidents may go unrecorded, and with targets to meet, some injuries may be under-reported. An electronic system for recording, called CRASH, might help, Mr Aldritt suggested.
Instead of licking their pencils and scribbling in their notebooks, police will enter details of accidents on a hand-held computer. CRASH should be trialled in the middle of next year, and available to all forced by the end of 2010, says the National Policing Improvement Agency. Better allow a bit of lee-way – it’s an IT system.
Meanwhile, we have only the haziest idea of how many people are actually seriously injured on the roads. It could be 26,000, 80,000, or 220,000. Amazing but true.


Martin Heaven (not verified) wrote,
Mon, 09/08/2010 - 08:51
Regarding HES statistics shown in graph 5b. Within HES there is the facility to include up to 12 cause codes, and these usually start off with the actual issues, eg fractured skull, the primary cause of admission and end up with other complications and information further down the list, e.g patient is diabetic, has asthma, RTA victim. I am led to believe (South East Public Health Observatory Information Group meeting 2010) that the completeness of secondary cause fields has been improving over recent years and this may be why alcohol related admissions is rising (these being calculated as attributable fractions). If this is the case the apparent increase in admissions shown in 5b may reflect previous under recording of the external causes of injury.
Differences in the absloute numbers is likely to he the result of differences in the definition of severity. Hospital data is primarily recorded so that the medical staff have access to all the complications for each patient for individual treatments. Individuals can be admitted more than once, for the same reason, or for a new reason.
KarenG (not verified) wrote,
Mon, 16/08/2010 - 08:01
Nice read! I have a question though, I can't seem to get your RSS feed to work right in google chrome, is it on my end?
alcohol treatment centers florida
Siraj (not verified) wrote,
Sat, 21/08/2010 - 13:04
It was an interesting article/post. I don't believe enough data has been provided to ascertain whether the reduction in injuries was as a result of speed cameras or as a result of safer cars.
None of the articles I've read supporting either side of the argument have taken into consideration differences in level of protection by new cars - like Anti-Lock Braking Systems (ABS), side impact protection bars (SIPS) and airbags.
Without the data normalised for this, I can't accept either result.
Robert Whiston (not verified) wrote,
Sat, 21/08/2010 - 14:14
While I was reading this article the same ideas that are mentioned by Siraj (above) came to my mind too. There is a disconnect between a) technology that advances yearly, and b). data collection that has its roots firmly planted in the 1960s or 70s for consistency.
Death to the driver caused by being 'speared' by the steering column have long disappeared, first with mechanically collapsible steering columns and then with the addition of air bags. Death by front screens' as objects thrown up at high speed decapitate the driver, or the driver and passenger being thrown forward and out through the screen on impact have disappeared with the introduction of laminated glass and seat belts.
Widespread use of Anti-Lock Braking Systems (circa 1990) can actually take longer to stop a car than normal brakes in given circumstances - it is the friction between road and tyre that determines stopping distance and both road surface and tyres have improved in 20 years. Greater rigidity of the monocoque, the use of thinner high strength steels (HSS) and 'crumple zones' have also enhanced survivability. That deals with some of the principal deaths/improvements to the car re: driver deaths.
For pedestrian deaths, campaigns for improvements to reduce deaths began even earlier - after the Triumph Herald (circa 1965), a car that epitomised how not to design a car which unwittingly inflicted as much damage to a pedestrian as was possible.
The advertising agency employed by the ministry that created the little girl killed killed at 40 MPH but survived at 30 MPH is, I feel, being economical with the truth. When dealing, for a short period in my life, with motor vehicle crash assessments, the idea of a head-on crash at 90 MPH was extremely rare. Even if both cars were traveling at that speed initially, the impact speed after braking would be no more (on average) than 30 MPH (death an still occur at that speed). Thus traveling at 40 MPH and only given a few seconds of hard braking would subtstantially reduce the vehicle-to-pedestrian impact speed. Only where there was no time to react, e.g. running out from behind a parked car, would the little girl in the TV advert suffer fatal injuries - and, IMO, that eventuality will happen whatever speed you are driving at.
tsl99 (not verified) wrote,
Sun, 17/10/2010 - 12:53
I think you've made some truly interesting points. Not too many people would actually think about this the way you just did. I'm really impressed that there's so much about this subject that's been uncovered and you did it so well, with so much class. Pacquiao Margarito Fight Video