Behind the headlines: crime maps versus policing information?
Last week the National Police Improvement Agency (NPIA) published the results of a very large randomized controlled trial (RCT).
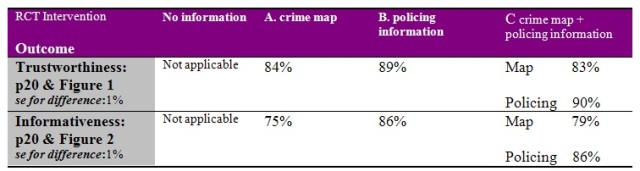
NPIA’s trial answered authoritatively whether local crime maps or policing information or the combination has the greater impact on public perceptions and which of them the public considered the more informative and trustworthy.
At the same time – and in apparent defiance of the NPIA evidence, gathered at a cost of over £250,000 – the Home Secretary, Theresa May, announced the publication of street-by-street crime maps. Was her mind made up, never mind the evidence?
The NPIA recruited more than 7,400 members of the public (aged 16+ years) who agreed to be randomized to: no information (1,879: the control group); crime maps (1,866); policing information (1,851); or crime maps + policing information (1,838: combined intervention). Participants who received information viewed a series of static screen-shots for their locality, as provided by their area’s police force. (Variation in the intervention between police force areas was thus a feature that analysts might need to address - but didn’t in the upfront report).
Policing information was the clear winner over crime maps for informativeness and trustworthiness. The results were clear and statistically highly significant (see Table). The combined format (crime map + policing information) did not do substantially better than policing information alone.
Mapping crimes is not the same as analysing crime maps. Provision of mapped data is not the same as drawing statistically-warranted inferences from the mapped data.
On public perceptions, NPIA’s robust RCT demonstrated that only ONE out of seven public perceptions (namely: whether local police were considered community-oriented) was influenced positively when information was provided: but only to a small extent with a mean score of around 5.1 being increased by 3 per cent. The information-format (A, B or C) did not matter a jot.
The other six perceptions were unchanged: how effective the police are, confidence in local police, whether crime was perceived as a problem locally, whether local crime was perceived to be increasing, likelihood of being a victim of crime, and worry about being a victim.
A very large, expensive RCT will have been worth it if it persuades Ministers to desist from spending public money on trying to alter perceptions about the police, and instead concentrate on altering on what matters – such as detection rates – and giving the police credit when credit is clearly due.
Hidden in Appendix C (p58), and utterly unsung in last week’s press coverage, is a massively significant vote of confidence in the police (ie z-score of 10, when around 3 signals p < 0.001) by those respondents who had themselves been a victim of crime. Their confidence in the police was higher by 19 per cent than that of non-victims! The police should be greatly heartened in their professionalism by this result, which dwarfs anything on information-format.
The NPIA did a very good job in selecting participants, who were recruited through a multi-stage sampling approach similar to that used by the British Crime Survey. Sampling was designed to give households [chosen by random selection of 334 postcode sectors – stage i); and, within each quarter-sector, by pseudo-random selection of 40 addresses – stage ii)], and then people aged 16+ years in those households [stage iii)], an equal chance of being selected.
(Aside: Does that mean that 53,440 addresses were selected (334 x 40 x 4)? We’re told that, of those invited to take part, 62 per cent agreed to be randomized. Respondents numbered just over 7,400, not 33,000, and so there’s something missing – from the sampling-description or my comprehension of it. The answer may simply be that a very high percentage of listed addresses turn out not to be households.)
NPIA really does deserve plaudits also for its random assignment of participants to intervention, but its report does not explain - as it should - why NPIA needed to randomize over 1,800 to each information-format. How large an effect was expected? The report does not explain, as it ought to have done.
One answer, which seems to be right (if surprising) is: very small effect. Otherwise NPIA’s RCT need not have been so large. Because crime maps and associated costs were introduced at the insistence of Ministers in the last government, it may have been very difficult for them to acknowledge that only a very small impact on public perceptions was plausible. And, that is indeed what NPIA found . . .
But Theresa May played no part in setting up the trial, or the crime maps. She had no prior commitment. Field-work for the trial took place in summer 2009, after which the 2010 election intervened, and results were only released by NPIA on 1 February 2011. After so long a wait, it is a shame that the analysis of NPIA’s RCT is far from clearly presented – which may be why its results have not influenced her judgement as they clearly ought to have done.
The results demonstrate that the public trusts policing information more than crime maps, and finds it more informative.
In terms of altering perceptions about the police, the provision of information had a small impact, so small that its provision for that purpose alone would be a public and policing extravagance. There was, however, a resounding vote of confidence in their police by those who had themselves been victims of crime.
Because statistical reporting standards did not match up to the standards expected of randomized controlled trials in medical journals. it’s taken me time and effort to get behind the headlines to the real story. Little wonder, then, if the Home Secretary was bemused by what this RCT’s expensively robust new evidence signified.
When you’ve designed ’em well, NPIA, you still need to analyse & report ‘em well.
Any future peer-review publication will expect the following to be properly explained.
- Three separate questions on the local police as community-oriented (listening to, understanding, dealing with local issues) were posed and scaled to provide a single measure on perceived community-orientation. Method of scaling was unexplained. Scaling of four questions on whether local police were perceived to be effective, and of five questions on the likelihood of being a victim of crime in the next 12 months, was also obscure.
- How many respondents were helped by interviewers to locate their home or a nearby landmark of those randomized to: A. crime map or C. crime map + policing information? Footnote 13 admits that help was given to some, but not for how many! Numerical transparency, please . . .
- On average, respondents spent 55 seconds looking at crime maps (excluding 3 outliers above 20 minutes) versus 43 seconds looking at policing information (excluding two outliers). However, comparison of means is impossible without their accompanying standard errors – where are they?
Conflict of Interest: SMB is acknowledged by NPIA as having been consulted on the design of its RCT, and is a member of Home Office’s Surveys, Design and Statistics Subcommittee. SMB writes in a personal capacity.

Anonymous (not verified) wrote,
Mon, 07/02/2011 - 18:30
This article is well below your usual standard, asidefrom the question of bias.
1. Is the objective of crime maps to improve confidence in the police or better inform the public about crime problems in order yo empower them to get the police to act?
2. Why does this research produce a result that seems to contradict all previous evidence that victims have less confudence than non-victims dI.e. interaction with the police does not appear yo be a positive experience. Does that not lead you to query the validity of the sample and this study?
Anonymous (not verified) wrote,
Tue, 08/02/2011 - 10:46
I, too, was surprised by the finding that victims have more confidence in the police than non-victims.
So inspired by the sentiment that we should dig behind the headlines (this time Professor Bird's headlines), I went to the report.
It's on the NPIA website: http://www.npia.police.uk/en/docs/Full_Report_-_Crime_and_Policing_Infor...
Now, I'm no statistical expert, but doesn't the appendix show the opposite to what Professor Bird is claiming? A positive coefficient for the victimisation variable means that victims have less confidence in the police, doesn't it? Look at the table C7 (page 58) closely, particularly the note below the table. Low scores on the 'confidence' outcome means low confidence, it says. Victim status is associated with higher values on the dependent variable, therefore lower expected confidence.
Amongst the control group, victims tend to have lower confidence in the police than non-victims. The effect is weaker in the treatment groups. But the direction remains the same.
Of course, it's a bit confusing that high scores on the confidence variable means low confidence, especially as in the other tables (e.g. table C2) high scores on the confidence outcome means high confidence. Encourages the sort of misreading that Professor Bird seems to have done.
My detective work here is done.
Paul Askew (not verified) wrote,
Thu, 10/02/2011 - 17:10
"Policing information was the clear winner over crime maps for informativeness and trustworthiness”. Here’s a further example of why that might not change anytime soon...
Despite the open data fanfare for those crime maps this month, the irony is that those crime mapping figures are internally inconsistent. Looking at the data for Cambridgeshire for example, the data at neighbourhood level totals 5926, and for street level 5916. Turns out to be 10 missing crimes. That’s less than 0.2%, and likely due to geographical rounding.
Probably not enough to matter to a macro analysis (with apologies to those 10 victims) but enough to raise questions. So which is the trustworthy figure? Probably comes down to the relative rather than absolute trustworthiness, and working with practical rather pure data.