The curious case of the missing graduates
The latest figures from the OECD on graduation rates across the developed world show that, relatively, the UK’s position is deteriorating.
In 2000, the proportion of young people getting a degree put the UK third, behind only Finland and New Zealand. In that year, 37 per cent of the relevant age group in the UK were graduating, against an OECD average of 28 per cent. By 2008, the latest edition of the OECD publication Education at a Glance shows, the UK’s figure had fallen to 35 per cent, while the OECD average had risen to 38 per cent.
There’s something very strange about this, as official UK figures on participation in higher education in the UK do not show a decline, but a slowly rising trend. In 2007-08, statistics from the Department for Innovation, Universities and Skills showed, 43 per cent of the age group between 17 and 30 began a course of higher education.
But the OECD report (Table A3.2, Trends in Tertiary Graduation Rates) shows the UK figure for graduates falling from 39 per cent in 2007 to 35 per cent in 2008. Such an abrupt change is impossible.
A note explains that there is a break in the time series for the UK following a methodological change in 2008, but does not elaborate. Annex 3 to the tables, which contains notes, provides no further explanation of what the methodological change may have been, but it has certainly had a dramatic effect on the UK’s relative position.
In fact, to draw any conclusions on the basis of this table would be unwarranted, though that did not prevent the OECD, Universities UK, the National Union of Students, and the University and College Union from doing so.
On the presumption that the revised methodology is correct, then the UK’s previous figures ought to be modified also, which implies that the position was never as strong as the comparisons made by all these people suggest. If the revised methodology is incorrect, then we have not fallen as far behind as everyone is assuming. (If anybody can shed light on what the methodological change was, I’d be delighted to know. The Higher Education Statistics Agency was unable to help.)
There is a further puzzle, however, for those who only follow higher education from a distance. Universities appear to have been expanding fairly rapidly in the past decade, yet the OECD figures show a declining proportion of UK-born students graduating from them.
Data from HESA confirm that there has been an expansion of around 310,000 students in higher education since 2001-02 (14.9 per cent).
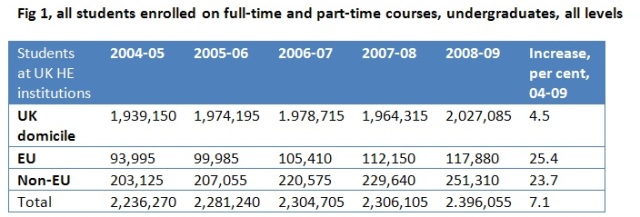
But, as often happens, there has been a change in the methods of measurement and a consistent time series exists only since 2004-05 (see Fig 1). Over that period, the numbers of full- and part-time students on higher education courses in the UK has grown from 2,236,270 to 2,396,055 – an increase of almost 160,000. But as Fig 1 shows, almost half that increase (72,070) has actually been due to foreign students, either from other EU countries or from outside the EU.

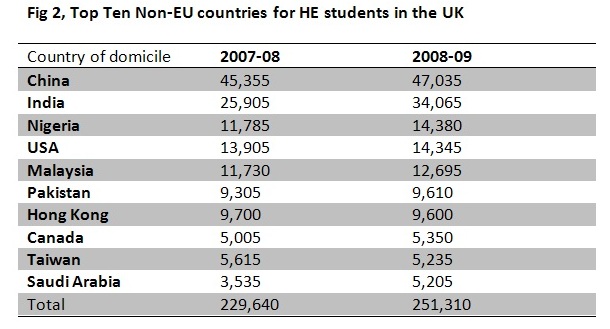
The reason, of course, is that universities can earn more in tuition fees from foreign students than they can from home–grown ones, so have made every effort to recruit them. Plenty of the non-EU contingent will take the opportunity to turn their stay into a permanent one, if given a chance, although this is unlikely to be true of Chinese students who form the largest group. HESA gives the following breakdown (Fig 2) by nationality for the top ten non-EU countries of domicile, somewhat oddly treating China and Hong Kong as distinct countries. Please don't tell the Chinese.


mary (not verified) wrote,
Wed, 08/09/2010 - 08:40
Having pointed out the discrepancy in the OECD table it would be interesting to know if HESA or OECD have done anything to verify the data? Improving trust in statistics requires government statisticians to be able to explain differences especially when international or national comparisons are being made and put the explanations in the public domain. It may be as simple as only using England & wales figures!
Neil Spencer (not verified) wrote,
Wed, 08/09/2010 - 09:50
Fig 2 is made to look rather odd by just listing the top ten countries and then having a total at the bottom which is for all non-EU countries. An "other" category (with 96.490 in it by my calculations) should/could be there as well which would also give added context to China's 47.035.
I also trust that there is nt some double counting going on. I assume that the term "China" in Fig 2 means "China excluding Hong Kong". Without this clarification it is possible that the Hong Kong students are included in China's total as well as being in their own category.
GF (not verified) wrote,
Wed, 08/09/2010 - 10:06
Taiwan is also considered separately :) But it's possibly related to where visas are applied for.
Patrick (not verified) wrote,
Wed, 08/09/2010 - 10:38
At Full Fact.org, we spoke to the OECD who told us that the change in method would have caused a reduction in the number for the UK graduation rate.
However, the assured us that since the UK still fell from third to fourteenth between 2000 and 2007 (years for which the data is comparable) so the story of a trend of relatively decline still holds true.
Even with the change of methodology the UK only apparently fell one place further down the league table from 2007 to 2008.
Almost every newspaper report has overlooked the statistical nuance, but we have covered it in full in this article
http://bit.ly/cT7K8j
Richard (not verified) wrote,
Wed, 08/09/2010 - 12:56
If the UK figures are considered odd, has anyone explored the overall OECD figures which from the above text show an increase from 28% in 2000 to 38% in 2008. Surely an increase of ten percentage points across a number of countries is more significant than a two percentage point reduction for the UK (ie 37-35% as in your para 2), and may be a bigger contributor to the UK's declining position?
Nigel Hawkes (not verified) wrote,
Thu, 09/09/2010 - 10:27
I can't agree with the OECD's reinterpretation of this data, as explained on the Full Fact website. If the change in the methodology (still unexplained) produces a four percentage point fall in the UK figure, then all the previous figures back to 2000 may need adjusting downwards by an appropriate amount, too. In that case, the claim that the UK was ever third in graduate production is untrue.
A four percentage point reduction to its 2000 figure - should that be the right correction - would have put the UK eighth that year, equal with Iceland and behind Poland. In 2009, it is 14th. There is a relative decline, caused by other countries increasing faster, but it is not as large as OECD claims.
Robert Whiston (not verified) wrote,
Thu, 09/09/2010 - 23:32
But isn't this typical of data providers. For some unannounced reason they alter the accounting year, the classifications or methodology. The biggest culprits are Whitehall Depts. It makes like for like comparisons imposible in many instances.