Immigration: a debate crippled by a lack of accurate data
Immigration has emerged as one of the major themes of the election, and one of the few where there are clear dividing lines between the parties. But the sensible discussion of the issue is hopelessly compromised by the unreliability of the data.
The Liberal Democrats want an amnesty for illegal immigrants who have been in the UK for more than a decade. This is opposed by the Conservatives, who say it would encourage a flood of new illegal immigration. They pledge to reduce immigration in future to “tens of thousands” a year by imposing a cap.
Labour, which declared in its 1997 manifesto: “Every country must have firm control over immigration and Britain is no exception” now argues that its recent adoption of a points-based system for would-be immigrants can provide that control. Gordon Brown has admitted that mistakes have been made, but denies suggestions from the ONS that Britain is heading for a population of 70 million, says net immigration is now falling, and that the Tory “cap” would be unworkable.
Nick Clegg, the LibDem leader, says that Labour’s policy over the past 13 years has been chaotic. His criticism at the failure to “count people in and count people out” certainly carries weight when one tries to extract the truth by interrogating migration statistics.
Just how many illegal immigrants are there? The LibDems put the figure at 900,000, and Nick Clegg said: “You can’t deport 900,000 people. You don’t know where they live.” But how reliable is this figure? MigrationWatch UK yesterday published a report claiming that a more plausible estimate would be 1.1 million, and that if they were granted an amnesty their relatives and dependants would have the right to enter Britain, approximately doubling the numbers.
The LibDem figure is at the upper end of the range contained in an April 2009 report from the London School of Economics for London Mayor Boris Johnson. This put the figure at the end of 2007 at somewhere between 417,000 and 863,000 – a big range. The LibDems chose the higher of the figures because they believe that the problem has been underestimated in the past, and added a few more to account for the past two years.
The nation’s population and, equally important, where they choose to live, are key issues for both national and local government. Yet both international migration and internal migration are measured by systems incapable of giving us estimates any more precise than this. Small wonder that the UK Statistics Authority commented in a report published last July: “Both users and ONS statisticians generally agree that migration statistics are not fit for all the purposes for which they are currently used and require further improvement.”
So just how are they calculated? Firstly, as Mr Clegg says, there is no system to count people in or out of the UK. Therefore, every measure of immigration is based on statistical calculations from data that is, or was originally, intended for other uses.
The basic data on migration levels come from the International Passenger Survey (IPS) and are published in the Migration Statistics Quarterly Report. The IPS surveys people entering and exiting UK airports, ports and the Channel Tunnel. A recent ONS report says that the IPS was originally designed for use in compiling the international tourism/travel account of the balance of payments. Modifications to the methodology, however, have improved the survey design to give better estimates of migration flows for the UK.
Around 230,000 IPS interviews were conducted in 2008 of which just 5,117 (or 2.2 per cent) were with travellers who declared themselves to be migrants. From this limited base, the total of immigrants entering the country in 2008 was estimated to be 531,000. Many of those classified as migrants would be leaving the UK, not entering, which emphasises just how small the sample is.
The second measure of migrant flows is the Long-term International Migration (LTIM) data. LTIM is a more comprehensive version of the IPS, including people that IPS doesn’t, such as the majority of asylum seekers and people crossing the land border between Northern Ireland and the Republic of Ireland. LTIM figures are also adjusted for people who eventually change their intentions once in the UK. Critics of the IPS point out that it only asks passengers’ intentions which, of course, are not necessarily the same as their final actions.
There are other data that can reflect migration levels. These measures, however, usually show the ‘stock’ of people who are not born in the UK or not UK nationals. The Labour Force Survey (LFS) and the Annual Populations Survey (APS) are two primary examples.
The LFS is one of the most comprehensive datasets in the UK, but it only measures private households. This misses a lot of migrant labourers, for example, who are often housed by their employers or rent accommodation in often overcrowded houses.
The APS collects similar data to the LFS and has a comprehensive programme of boost surveys to increase the sample size and give a more representative regional view. However, it falls into the same trap of relying on data from private households.
Administrative data can also be used as a source of information on immigration. The most comprehensive of these is the National Insurance numbers (NINos) issued to overseas nationals by the Department of Work and Pensions. There is also information available from the Worker Registration Scheme (WRS) which covers all work applications from Central and Eastern Europe EU accession countries (those that have joined the EU since May 2004).
There are disparities between the different measures. In the year to June 2009, 628,000 NINos were issued to non-UK Nationals, a decline of 15 per cent on the year to June 2008. However, according to IPS estimates, long-term immigration to the UK in the year to 2009 was 518,000.
This suggests that some 110,000 more NINos were issued to non-UK nationals than long-term immigrants arrived in that year. It’s not entirely clear how this difference is accounted for. In part, it may be that the IPS figure is usually lower than the more final LTIM figure (IPS estimates have been revised up by around 40,000 a year over the last few years). But that seems hardly enough to account for the difference, especially as one would expect fewer NINos to be issued to a cohort of immigrants than the size of that cohort, because it will include children under the age of 16.
There are some disparities in the data for the WRS too. According to the latest quarterly migration figures, in the year up to June 2009 there were 118,000 successful applications for the WRS from the A8 countries that joined the EU in May 2004 (Czech Republic, Estonia, Latvia, Lithuania, Hungary, Poland, Slovakia and Slovenia). This is a 40 per cent decline on the year up to June 2008 in which there were 190,000 successful applications from A8 countries.
In contrast, the LTIM figures show that there was inflow of only 84,000 migrants from the A8 in 2008, and 101,000 in 2007. For the two years taken together, the total was therefore 185,000, according to LTIM. But this was less than the number of WRS registrations from the A8 in the single year to June 2008, even though LTIM figures include people who would be too young to work in the UK or, may be entering to join a family.
This disparity in WRS figures could be explained by the fact that immigrants who are self-employed do not need to be registered under the WRS, or that not all those who arrived from the A8 decided to stay after all. But the gap is a large one and hard to account for.
None of this proves that we have lost control of the amount of immigration into the UK, but it does point up major areas of uncertainty that would not be tolerated in other statistics of equal importance – GDP measures, for example.
There are a lot of issues that are unclear about the current measures of migration. The first is the obvious one mentioned earlier – the IPS gathers data on intentions not actions. There are also questions about definitions. The data for long-term immigrants are for people in the UK for more than a year. This leaves difficulties in comparing administrative data like NINos and WRS numbers with the other estimates.
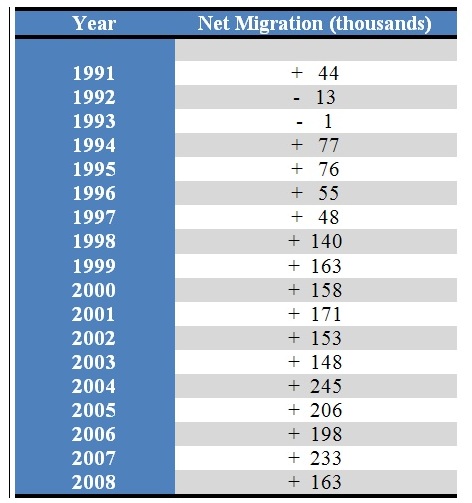
That said, what are the actual figures? Table 1 (below) shows the net migration level in thousands, according to LTIM data since 1991.

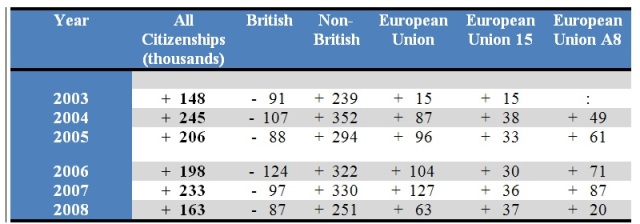
This undeniably shows a sharp increase in net inward migration after 1997, when Labour won power, and a second increase between 2003 and 2004, when the A8 countries joined the EU. Table 2 shows the effect of this wave of immigration.

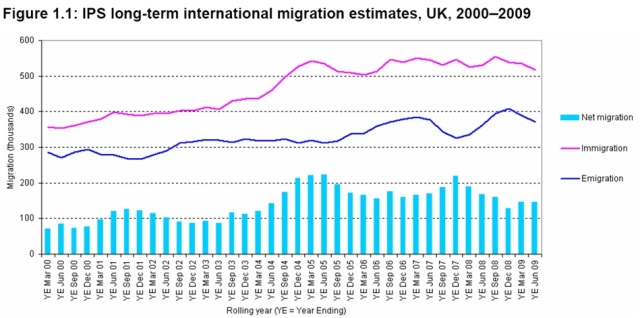
Although there was a noticeable jump in overall EU migration in 2004, the increase was not only from the A8. An additional 23,000 migrants from the European Union 15 also arrived. Here is the most recent migrant data in graphical form:

After the high levels of immigration from A8 nations since 2004, recent trends show that net migration is falling. In fact, the IPS finds that Poland was the most popular country of next residence for non-British emigrants. 50,000 people migrated there in 2008 : Poles returning home. And between 2007 and 2008, the number of non-British citizens leaving the UK to take up “a more definite job” grew from 45,000 to 62,000.
From the uncertainties, one message seems clear. Any incoming government – whether imposing a cap on migrants, distributing migrants regionally or using a points-based application process – has a lot of ground to make it in measuring migration more effectively.
The new MigrationWatch report gives reason for believing that the LSE figure relied upon by Nick Clegg may be an underestimate, even though he chose the upper limit of the LSE figures and then added a few more. The principal reason given is that the LSE team assumed that of those granted short-term visas between 2001 and 2007 (12 million people) all but 50,000 went home again when their visas expired. That seems highly unlikely, says Migration Watch.
It would mean that 99.5 per cent would have returned home at the end of their stay. MigrationWatch guesses that the figures is more likely to be around 97 per cent, which means 60,000 “overstayers” a year, rather than 50,000 over seven years. We may be able to measure this more accurately in future, as the e-borders scheme comes into effect.
An amnesty on these people, whether there are 618,000 (the LSE central estimate), 900,000 (the LibDem estimate) or 1.1 million (MigrationWatch’s estimate) would be hard to implement. It would apply only to those here for more than ten years, but that will be hard to verify, since they have no papers.
When such a scheme was applied to Mexican illegals in the US in the 1980s, three quarters of the applications were found to be fraudulent. And what subsequently occurred was another wave of immigration from Mexico. A total of 2.6 million illegals were granted amnesty in 1986: by 2000 there were an estimated 9.3 illegal immigrants in the US, many of whom had come to join family members legalised by the amnesty. Spain and Italy have also granted amnesties, but still have many new arrivals.


