Searching for happiness around the bend
Is happiness U-shaped? Everywhere but in the US, it seems.
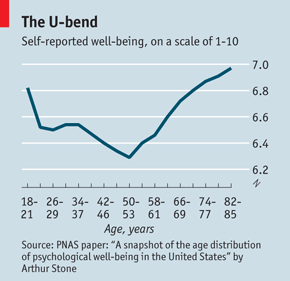
The idea that happiness follows a U-shaped curve as people age – starting high among the young, slumping to a minimum around middle age and then rising again up into the 70s – has been around for several years. Among its originators and chief proponents are the economists David Blanchflower (Dartmouth College) and Andrew Oswald (University of Warwick).
The idea got its most recent outing in an article in The Economist (The U-Bend of Life, December 16 2010). The magazine published this persuasive graphic to illustrate the piece.

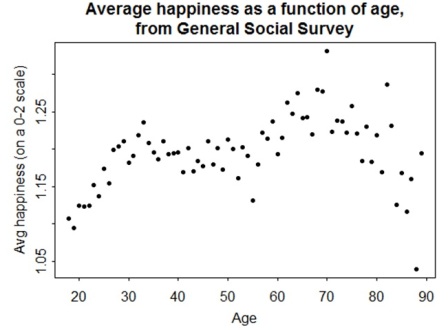
But Andrew Gelman, Professor of Statistics and Political Science at Columbia University questioned it. He said on his blog (26 December) that he had followed up the original articles on the subject by trying to reproduce the curve using data from the US General Social Survey, for use with his introductory statistics class. He writes: “The idea was to start with the fascinating U-shaped pattern and then discuss what could be learned further using some basic statistical techniques of subsetting and regression.”
Except that it didn’t work, at least for him. The curves he got were not U-shaped at all, though they had a hint of a U between ages 35 and 70. But the rest bore little resemblence to The Economist curve nor to those published in the literature. Instead of maxima at 20 and 85, his graph had minima at these two ages. See below:

He tried to find explanations, consulted colleagues, read the paper on which The Economist based its graphic, and finally concluded that the U-shaped curve is a shy creature that appears only to believers, is but one among many patterns of happiness over the life-cycle, may be subject to sample-selection bias and to the use of linear and quadratic terms which make everything look like a parabola.
But Blanchflower and Oswald have not taken this lying down. In a comment attached to Gelman’s blog, they claim that the explanation for his failure to find the U-curve is American exceptionalism. “It isn’t hard to find in data for any other country” they say, referring to a response by them to a similar but anonymous criticism published in Social Science and Medicine in 2009.
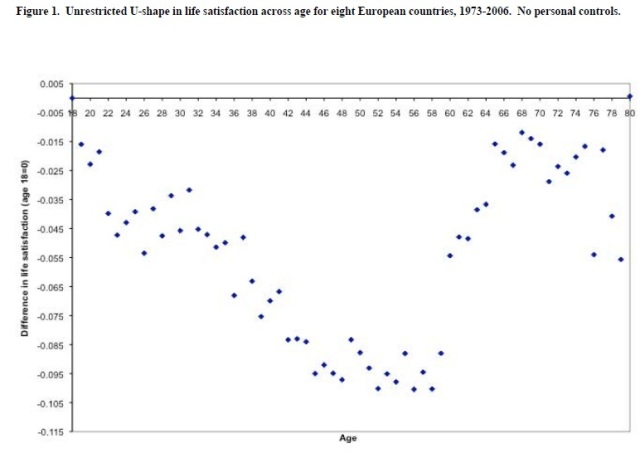
This anonymous critic had claimed that the appearance of the U-shaped curve resulted from the use of inappropriate and questionable control variables. Not so, say that two economists: in many countries the U-shaped curve appears in the raw data and it is only in the US that control variables are needed to bring it out of hiding.
They publish a curve for life satisfaction measured by Eurobarometer in eight European countries, (Belgium Denmark, France, Germany, Italy, Ireland, Netherlands and the UK) with no corrections made for variables such as marital status. A clear U-curve is created (below) though it tails off over the age of about 70.

In the US, they say, the U-curve can only be obtained if corrections are made for marital status. So why is the US exceptional? Blanchflower and Oswald speculate that it may be because of different trends in marriage - and presumably divorce - but that the issue remains open. “The difference between the (apparently somewhat unrepresentative) United States and many other industrialised countries is a topic on which more work is required” they conclude.
Students of well-being may be interested to know there is a public meeting on the topic this Thursday, 27 January, at the New Theatre, East Building at the London School of Economics, starting at 6.30 pm. Hosted by the ONS team charged by David Cameron with devising a way to measure national well-being, the event takes the form of a panel discussion chaired by Mark Easton of the BBC. The panel will comprise Professor Paul Dolan of the LSE; Trevor Phillips of the Equality and Humans Rights Commission and Aileen Simkins of ONS.
The title of the meeting is Measuring National Well-being: is Happiness the Answer? Details and Free tickets are available at the website though if my experience is any guide you may have to search the site using the word well-being to find them.


misterjohn (not verified) wrote,
Mon, 24/01/2011 - 23:59
"Measuring Nagtional Well-being: is Happiness the Answer? "
They've even invented a new word to camouflage the inadequacy of the analysis.
Nigel Hawkes (not verified) wrote,
Wed, 26/01/2011 - 11:41
My spelling mistake, which I have now corrected