Is Wales really as poor as Romania?
There is wailing and gnashing of teeth in Wales at the disclosure, through Eurostat data, that two thirds of the principality by area is poorer than a region of Romania. “How on earth have we fallen below a part of Romania in the prosperity table?” asked an editorial last week in the Western Mail.
To put the comparison in perspective, the region of Wales being unfavourably compared to Romania – West Wales and the Valleys – is not a natural division of the country, but a construct devised back in 2000 to make the most of EU structural funds. By combining Wales’ poorest areas into a “region” that bears no relation to geography or history, it was possible to create an area where GDP per capita fell below 75 per cent of the EU average, qualifying it for aid from EU structural funds. This was known at the time as Objective 1 status.
Furthermore, the region of Romania used in the comparison is not a remote rural district, most of which are considerably poorer than any part of Wales, but the region that includes the capital, Bucharest. Capital cities generate high rates of GDP per capita, not least because people commute into them from surrounding areas and their productive capacity is counted where they work, not where they live.
Capitals are also the base for the civil service and the headquarters of companies. Inner London has a GDP per capita more than three times the EU average – it is comfortably the wealthiest “region” in Europe. Outer London, however, has a per capita GDP marginally below the EU average. West Wales and the Valleys excludes Cardiff, the capital of Wales. So these comparisons have to be handled carefully.
More carefully, certainly, than the contribution made yesterday by Dylan Jones-Evans, economic adviser to the Welsh Conservative Party, writing in the Daily Post. He writes: “Back in 2000 when we first received European funding, West Wales and the Valleys was the sixth most prosperous Objective 1 region in Europe with a GDP per head of 17,300 Euros. However, by 2008 the region had fallen to 42nd out of 50 regions with a GDP/head of 15,700 Euros.”
Has this huge area of Wales really suffered a lost decade of declining incomes? Measured in Euros, yes. In 2000 the pound was riding high, worth over €1.7 at its peak. Today it stands at just over €1.2. So a growth of GDP per capita from just over £10,000 a year to just over £13,000 in West Wales and the Valleys between 2000 and 2008 translates into a decline when denominated in Euros.
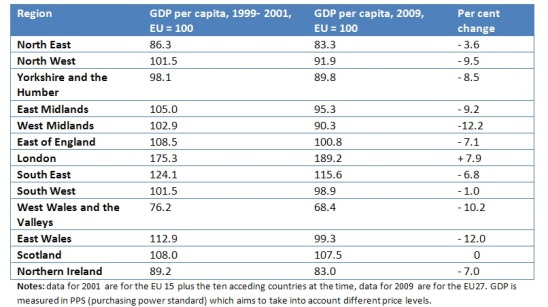
The shifting exchange rate is, indeed, largely responsible for the apparently poor economic showing of this region of Wales, and for many other regions of the UK (see Table). GDP per capita, measured in purchasing power standards, has fallen relative to the rest of Europe in most areas of the UK and in some of them, including East Wales, at a faster rate than in West Wales and the Valleys. (The table does not include all areas and Inner and Outer London are combined, as are the regions of Scotland. Fuill data in the link above.)

So, relatively speaking, East Wales has performed worse than West Wales and the Valleys, where the EU funds have probably made some difference. It’s undeniable, however, that Wales as a whole has done relatively poorly.
That is also in large part the result of shifts in the exchange rate. In the 1990s, Wales ran a very successful policy of attracting large manufacturing companies: in employment terms, it was the UK’s only growing manufacturing region. But the high exchange rate of the pound at the end of the 1990s and early 2000s had a disastrous effect, encouraging companies to relocate and causing a rapid decline in jobs over a short period.
Some relocated to the countries newly acceding to the EU, others to Asia. The Welsh model had failed, thanks in part to an overvalued pound. Now the effects of that setback look worse because of an undervalued pound.
It’s right that politicians and media in Wales look closely at how the EU funds have been used, and whether the new model for development is robust. But some of the claims being made are based on a partial reading of the statistics.


Anonymous (not verified) wrote,
Wed, 21/03/2012 - 14:27
You say the full data for your table is in the link, but it isn't. Where did you get the 1999-2001 GDP per capita data from?
Nigel Hawkes (not verified) wrote,
Thu, 22/03/2012 - 11:37
Sorry - I should have included a link to the earlier data, published in February 2004, of regional GDP data in the EU and acceeding countries in 2001. It's here: http://epp.eurostat.ec.europa.eu/cache/ITY_PUBLIC/2-18022004-AP/EN/2-180.... Romania was not then an acceeding country, so it isn't included in these statistics, so we can't tell if the Bucharest region was richer than West Wales and the Valleys in 2001.