The coding maze: mortality ratios and real life
Much anxiety has been caused by the publication over the past decade of hospital mortality ratios.
They aim to compare hospitals by calculating how many patients die in each, correcting the figures by allowing for factors outside the hospitals’ control – severity of disease, age, sex, route of admission (emergency or elective) and comorbidities.
But a hospital’s quality of care measured in this way often differs sharply from the assessments made by the regulator – formerly the Healthcare Commission, now the Care Quality Commission (CQC). Many statisticians question whether it is possible for mortality ratios to capture the full complexity of variations in care, and doubt that the results are meaningful.
A leading company in the production of mortality data, Dr Foster Intelligence, publish an annual Good Hospital Guide which in 2009 identified five hospitals as among the most improved over the past three years. These included Mid-Staffordshire NHS Foundation Trust, which at about the same time was being branded “appalling” by the CQC.
How could this conflict of evidence arise? More important, what did it mean to patients worried by hospitals with apparently high mortality ratios, or comforted by Dr Foster’s evidence into believing that a previously-poor hospital had turned the corner? Such were the discrepancies and the embarrassment caused to the Department of Health that Sir Bruce Keogh, Clinical Director of the NHS, has set up a committee to investigate, chaired by Ian Dalton, chief executive of NHS North East.
My own investigations, aided by an analysis (1) carried out by one of Dr Foster’s rivals in the marketplace, CHKS, suggest that the diagnostic codes given to patients by some hospitals may have had undue influence on the published outcomes. The results of these inquiries has now been published in the BMJ (2). This version of the story is aimed at those who do not read the BMJ.
Dr Foster’s version of mortality ratios developed from the work of Professor Sir Brian Jarman at Imperial College, London. He is acknowledged as the leader in the field. From administrative data such as crude death rates and the diagnostic codes given to patients by hospitals to reflect the illnesses from which they are suffering, Professor Jarman developed his Hospital Standardised Mortality Ratios (HSMRs).
These aim to make allowance for every important variable that determines whether a patient admitted to hospital lives or dies, so that what is left is a measure of the quality of care. HMSRs have become an important index, used by many hospitals to determine how well they are doing, and for the Good Hospital Guide they form one of a number of measures used to produce a “league table” of the best hospitals in England.
Like others, I was puzzled when Mid-Staffs emerged in the top ten hospitals in the league table in November 2009, using data gathered during a period when its chief executive was admitting that much still needed to be done to turn the hospital round. Looking closely at the data published by Dr Foster, it appeared that Mid-Staffs had found a new and better way of treating broken hips (known as fractured neck of femur, or FNOF).
This is an injury often suffered by elderly people, and it has a significant death rate of around 10 per cent which has changed little over decades. Confined to bed, patients with fractured neck of femur often develop other conditions and die. There was no real reason to believe that Mid-Staffs had discovered a magic solution to this problem, yet its standardised death rate for FNOF was very low - 19.87, against a national average set at 100. That meant that less than a fifth as many patients with FNOF admitted to Mid-Staffs were dying as in the average English hospital. This is implausible. No other hospital in Dr Foster’s top 30 came close.
I asked the trust if this figure was right, and it confirmed that it was, attributing the result to “substantially improved coding procedures”. That meant that its improved rating for FNOF – well below that for other emergency conditions treated by the hospital – was the result of changes in the way it attributed diagnostic codes to patients.
Coding is not an exact science. From reports by doctors, the coding departments at hospitals attach codes appropriate to the conditions suffered by the patients. Codes are used to determine what hospitals are paid under the payment by results system. A single patient may have many codes – up to a dozen – but the average code per patient across the NHS was, according to CHKS, around four in June 2009. This represented a rise from about three in April 2005.
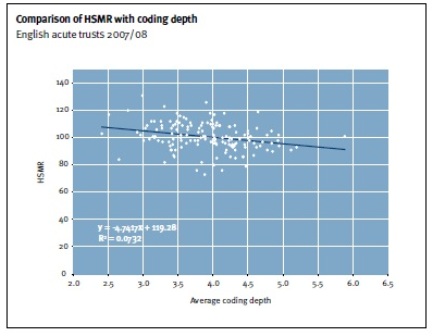
There is also a big variation in the number of diagnostic codes per patient from hospital to hospital, from a low of less than three to a high of over five. This may simply reflect a variation between hospitals in the number of comorbidities suffered by their patients – some hospitals treating iller patients than others – or it may reflect a difference in coding practice. It is the view of Professor Jarman and of Dr Foster that coding depth does not have a significant effect on HSMRs.
The graph below is taken from a response made by the Dr Foster Unit at Imperial College to criticisms of HSMRs published in the BMJ by a team at Birmingham University (3). The points are widely scattered but it does show a link, such that a hospital using only 2.5 codes per patient would show an HSMR about 15-20 points higher than one using 5.5 to 6 codes per patient.
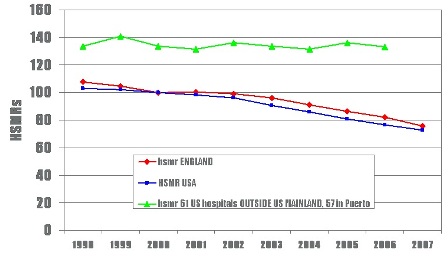
Could increasing coding depth be the cause of the steady fall in risk-adjusted mortality detected by both the Dr Foster Unit at Imperial College and CHKS? In 2009, Dr Foster reported that HMSRs had declined by 7 per cent in a single year, while CHKS has seen a 50 per cent decline in its own mortality ratio measure, called RAMI (risk-adjusted mortality index) over five years. Actual deaths in NHS hospitals in England have not fallen at all, see Table below (figures from CHKS).
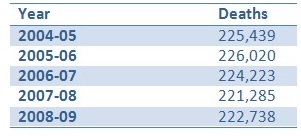
So if crude deaths have not fallen but risk-adjusted deaths have, something else must be happening. Professor Jarman’s explanation is that the severity of the conditions treated by hospitals has indeed risen, as milder cases are increasingly treated in the community or as day cases. So he sees the fall (below) as a real effect. CHKS is unconvinced.
At Mid-Staffs, it appears that a substantial part of its improvements in HSMRs is due to deeper coding. That may be because it was under-coding before, or that it is over-coding now, but it certainly suggests that coding changes are a much easier way of improving a hospital’s results than actually improving care.
In the case of a handful of hospitals, the key to greatly-improved risk-adjusted death rates is the use of the code for palliative care. Over the past five years there has been a big increase in the use of this code, Z51.5, from under 400 deaths a month in 2004 to 1,800 a month by 2009 (CHKS figures). Patients coded Z51.5 are assumed to have come into hospital to die, so allowances are made in correcting death rates. Otherwise, hospitals would be blamed for failing to save the lives of patients whose lives cannot be saved.
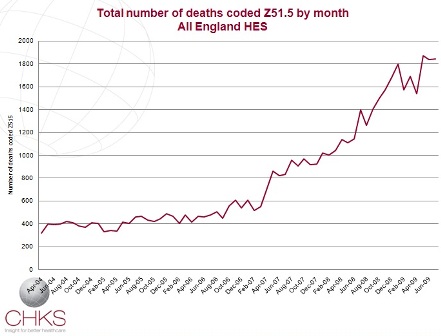
Again, there is a big variation from hospital to hospital. In 2007-08, 5 per cent of deaths were coded Z51.5 in English hospitals, but in a handful it was as high as 20 per cent. By 2008-09, the average had risen to 7.8 per cent, but some hospitals were coding more than 50 per cent of deaths as palliative care. By April-June 2009, the all-England average had reached 11.3 per cent, with five hospitals coding more than 30 per cent of their deaths as palliative care. Each bar in the graph below represents a trust, showing the huge range across the NHS in England in the use of code Z51.5
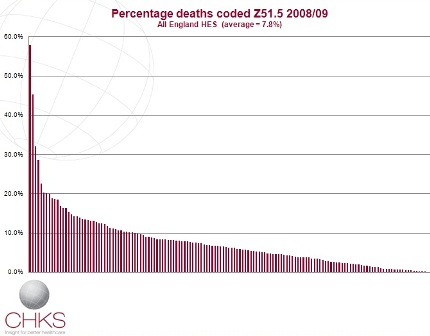
Professor Jarman believes that a handful of hospitals have reduced their risk-adjusted death rates significantly by heavy use of Z51.5. This is not to say they were wrong to do so: some areas lack palliative care facilities and more people die in hospital. But even if the use of the code was appropriate, the powerful effect it has on HSMRs suggests that some hospitals’ improved performance is less to do with better care and more to do with better coding.
One such hospital is Walsall, identified as one of Dr Foster’s “most improved hospitals” over the past three years. It uses the Z51.5 code heavily, and has seen its HSMR fall by more than 30 per cent in the past three years. Dr Mike Browne, the Medical Director at Walsall, says that huge efforts have been made to tackle high death rates identified there in 2002 by Dr Foster. These changes include improving coding, and Dr Browne believes that increased palliative care coding contributed a third of the hospital’s recent improvements in HSMR.
Dr Browne, like CHKS, questions whether risk-adjusted death rates are valuable for making comparisons between hospitals. He sees their main use as pointing to particular services within hospitals that need improving, and says that at Walsall they have proved very useful in this way.
Certainly hospitals that do badly in the Dr Foster guide tend to look to improved coding, as well as improved care, to boost their status. Basildon and Thurrock had the worst HSMR in England in the 2009 guide, despite being rated “double excellent” by the Healthcare Commission just a month before. Its decision on hearing the figures? To recruit not more doctors, but more coders.
The arguments about HSMRs have come to a head because of the health department’s review. It wants to put an end to situations in which the inspectorate finds a hospital satisfactory, only for Dr Foster to declare it dangerous. Last month Professor Jarman issued a list of 25 hospital trusts that had high HSMRs, which he said had contributed to 4,600 excess deaths in 2007-08. What are patients meant to make of such claims?
Given the wide range of HSMRs recorded across English hospitals, it is far from clear that the differences mean very much at all. Identifying outliers ought to be possible using funnel plots with 99.8 per cent control limits. If variations were random, then just 0.2 per cent of hospitals would lie outside those limits; in fact 40 per cent do. But it is not clear whether this big variation is actually due to differences in quality of care, or to other factors such as coding and data quality.
Two recent papers in BMJ (4,5) concluded that HSMRs were unfit for purpose because the signal to noise ratio is so unfavourable, and the variance simply too great to be attributable to quality of care. HSMRs are, concluded Richard Lilford and Peter Pronovost, “a bad idea that just won’t go away”.
References
1. Hospital Standardised Mortality Ratios and their use as a measure of quality, by Dr Paul Robinson (CHKS, available online)
2 Patient coding and the ratings game by Nigel Hawkes (BMJ 2010;340:c2153)
3. Monitoring hospital mortality: a response to the University of Birmingham report on HSMRs
4. Using hospital mortality rates to judge hospital performance: a bad idea that just won't go away by Richard Lilford and Peter Pronovost (BMJ 2010;340:c2016)
5 Assessing the quality of hospitals by Nick Black (BMJ 2010;340:c2066)


Brian Jarman (not verified) wrote,
Tue, 04/05/2010 - 15:33
Dear Nigel,
It might be worth mentioning that when Mid Staffs and Basildon & Thurrock, two trusts that had high HSMRs but were reported as good by the Healthcare Commission, had actual on-site inspections they were both found to have poor standards of care.
The US Joint Commission 2008 report to the Department of Health commented on the self-reporting system used by the Healthcare Commission:
‘annual on-site review sample is approximately 4%...’ ‘This is generally worrisome, but it is of even greater import in the light of the fact that in the at-risk on-site evaluations, two-thirds of the assessments of standards compliance do not conform with the organization’s self-assessment findings,…’
We found (see our 2004 BMJ paper) that HSMRs correlate significantly with inspection findings but not with the trusts' self-reported measures as used by the hospital regulator (CHI, CHAI, then HCC, now CQC).
It is true that 'gaming' of the coding is possible but it is possible to detect step changes in coding practice eg of palliative care, or whether a diagnosis is coded as primary or secondary, and determine the associated change of HSMR. Similarly with changes of the number of secondary diagnoses coded. It is also possible (though it would take longer than the monthly HSMR analyses) to measure the proportion of patients who died in, say, the first week after discharge outside the hospital. Variations of coding practice may well increase a trust's expected deaths but after mortality reduction initiatives one looks for reductions in the number of observed deaths. However, changes in palliative care coding and the number of comorbidities codes don't have much effect on the relative values of the vast majority of HSMRs. A few trusts’ HSMRs are particularly affected by omitting palliative care patients in terms of their point estimates of their HSMR values, though not in terms of their HSMR banding, so if they were low then they were still low in terms of HSMR banding. No trusts were as much affected by not adjusting for comorbidity: the high ones stayed high and the low ones stayed low, but some will move around a bit that will take them just over or just below the upper control limit.
We specifically do not claim that HSMRs "capture the full complexity of variations in care" and it is important to remember that HSMRs should be considered in conjunction with the monthly mortality alerts that we at Imperial College send to any acute trust (whether or not they use the Dr Foster tools) that has high death rates over the preceding 12 months for a wide range of diagnoses and procedures (using CUSUM charts to detect 'signals' with less then 0.1% chance of being a false alarm).
Brian.
Frank Hammond (not verified) wrote,
Sat, 15/05/2010 - 21:58
The drive by Jarman and his team to concentrate the NHS on quality and mortality measures is a useful and noble one.
A main criticism is that the "end justifies the means" approach has been pushed too far by them and undermines other players who are trying to push the same agenda.
The "unfit for purpose" label of the HSMR mortality measure in teh BMJ editorial may push back this part of the quality agenda.
There are many problems with the HSMR measure, addressing some of the points mentioned above:
1) The Tunbridge Wells Trust that was severely criticised by the HCC for its clinical care, had a low Hospital SMR score or around 90. The Trust has several Community Hospitals it transfers patients into.
2) The Jarman comment above does not address the outlier low HSMR score for Mid Staffs for Fractured Neck of Femurs.
3) Jarman writes that it is possible to detect step changes in coding, has he undertaken an analysis for Mid Staffs which has seen a large drop in HSMR since it was investigated by the CQC?
4) The CQC in their Mortality Monitoring state that some condition's HSMR are affected by the availability of Community Rehabilitation services,
It is difficut to believe that Jarman and his research team deny that greater Community rehabilitation facilities are not linked to lower Hospital deaths.
5) Why has Jarman and his team not also looked at the standard 30 day mortality rates which has been a tried and tested method for many year?
6) Have Jarman and his team examined Walsall Hospital, whcih is thier flagship example of mortality reduction for changes in coding and community discharge effects?
It would be better in addition to absolute HSMRs to look at relative movements of mortality rates in addition to coding factors, community services on Hospital Discharge and Community services as substitutes for Hospital admissions. The present professional associations mortality studies can be built on.
Skill and knowledge would be required which is not necessarily present in Hospitals.
PCT, SHA and Hospital epidiomologists could usefully transfer skills.
Frank
Semiramida (not verified) wrote,
Thu, 09/12/2010 - 08:57
Just wanted to drop a comment and say I am new to your blog and really like what I am reading. Thanks for the great content. Look forward to coming back for more. http://www.yahoo.com
FubrolveFloge (not verified) wrote,
Tue, 12/04/2011 - 15:29
Excellent post with some good info, think i'll share this on my twitter if you don't mind and maybe even blogroll it depending on the feedback, thanks for sharing. My blog: Papper