NICE confusion over drug uptake
The NHS Information Centre has issued some “experimental statistics” covering the take-up of medicines approved by the National Institute for health and Clinical Excellence (NICE).
With experiments, it’s customary to have some hypothesis to test. But in this case it’s hard to work out what that hypothesis is.
Is it to dispel the idea of “NICE blight” slowing the uptake of new drugs? Is it to measure whether NICE’s predictions of medicine use are right? Is it to measure variation in use across the country? Is it to determine if doctors are following NICE’s advice? Or did nobody think very hard before putting the data together?
The published figures compare the actual use in 2008 of 12 medicines with the use predicted by NICE when it carried out its appraisals. The conclusion is that in seven cases, use was higher than predicted and in six it was lower. (In one of those for which it was lower, natalizumab for multiple sclerosis, use is rising and is expected to exceed predicted levels in 2009.)
In several cases, the NICE guidance was issued late in 2007, far too late to have had much influence on 2008 usage. Guidance on one of the medicines, entecavir for chronic hepatitis, was not issued until August 2008, two thirds of the way through the year in which its use was being measured. And in the case of the smoking cessation drug varenicline, guidance was issued in July 2007 when its use already exceeded NICE’s estimate for 2008.
So in these cases and several others, no conclusions can be drawn on whether the guidance had any effect on uptake. They do not disprove the industry view that the NHS is slow to adopt new medicines, in spite of claims from NICE that they vindicate its work. Andrew Dillon, chief executive of NICE, said the report showed that NICE was having a significant effect on the treatment patients receive from the NHS, and that its guidance is seen to represent value for money.
But one could equally easily come to the opposite conclusion. The predictions against which use was measured were made by NICE. So the fact that some drugs, such as those for insomnia, are prescribed to nearly five times as many patients as NICE expected could be taken as evidence that its advice is being ignored.
The Information Centre itself was more cautious, saying the study was subject to multiple interpretations, making it impossible to say if drugs were being over or under-prescribed. So why did it do the work in the first place?
What matters in this instance is not whether use matches predictions, but whether the predictions are right. NICE guidance aims to limit the use of drugs to those patients who can genuinely benefit from them, while the industry wants doctors to prescribe its products to as wide a group of patients as possible. The results could be interpreted to mean either that prescribing is too high in a majority of cases, or that the predictions were too low.
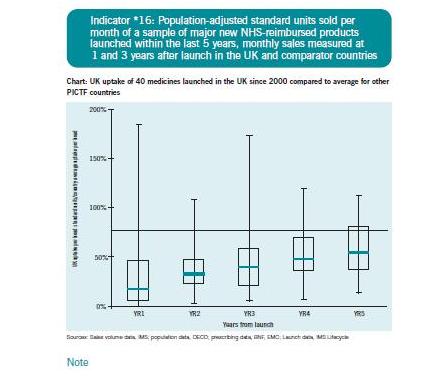
International comparisons suggest the latter. The figure below is extracted from the Pharmaceutical Industry Competitiveness Task Force indicators, published in 2007. Though now several years out of date, it does suggests that in comparison with other countries, the UK's use of new drugs is low. The horizontal line represents average uptake in developed countries, the boxes the interquartile range for the UK, and the line across the boxes represents the median.

This suggests that even five years after launch, the UK is still well-below average in its use of medicines. Nothing in the new report from the IC does anything to disprove this. Or to prove or disprove anything at all, as far as I can see.


Andy Sutherland (not verified) wrote,
Fri, 18/09/2009 - 14:33
Experimental statistics are new official statistics undergoing evaluation, and on which comments are sought to inform improvements to them. The "hypothesis" being explored is that they are good enough to support user needs, and the expectation is that improvements will be needed. The figures were issued to illustrate what information could currently be provided on the uptake of drugs positively appraised by NICE, an issue of legitimate public debate. The NHS Information Centre welcomes comments on their usefulness and relevance, including on additional key figures which would be helpful.
Andy Sutherland, Head of Profession for Statistics, NHS Information Centre