Obesity: rising tide or flat water?
Almost all today’s papers, together with the BBC, ran very alarming stories about the “soaring” rate of obesity. Half British men could be obese by 2030, said The Guardian: the same line was taken by The Independent, which forecast a rise in obese adults of 73 per cent by 2030.
The gloomy forecasts came from The Lancet, which held a press conference yesterday at which various experts presented their data. It is undeniable that obesity has risen sharply in the past 25 years: but is it reasonable to project this increase forward into the future? Recent trends in England, concealed or misrepresented in many of the slides presented at the press conference, suggest not.
The table below summarises data on overweight and obesity taken from the Health Survey for England. It shows that obesity and overweight plus obesity are both very high by historical standards. But they do not show dramatic increases, or any increases at all in some categories, since 2001. The trend appears to be flatlining. While not wildly encouraging, that sounds a lot better than some of The Lancet’s speakers.

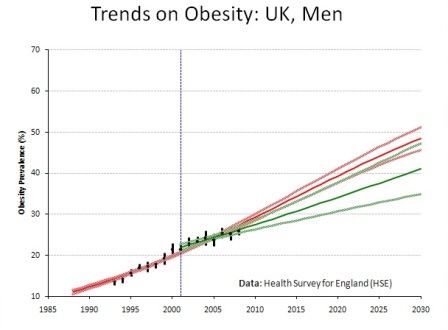
Some simply misrepresented the recent trend. Take the graph below, which purports to be the trend for adult male obesity in England. The actual figures, from the same source used for this graph, show that the trend from 2002 has actually been flat. For 2009 (not included on the graph, I notice) the proportion of all men who were obese was 22.1 per cent, the same as in 2002. That is far from the impression given.

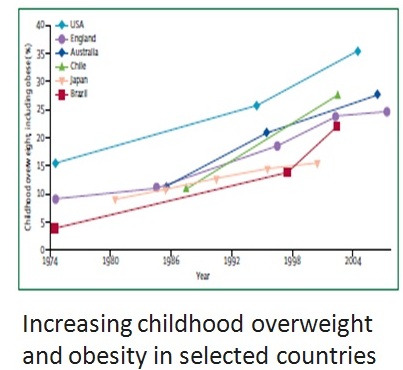
Another slide (below) was devoted to childhood obesity in selected countries. It contains no data since 2005 for England – fortuitous, since the trend since then has shown a quite sharp decline for all age-groups (see table for the 2-15 group). I can’t answer for the other countries in the graph.

Recent trends may not be a reliable guide, but an honest presentation of the data demands that they be included. They provide some grounds for believing that obesity has peaked in England. That doesn’t mean, of course, that its effects will not be felt more strongly in illness and healthcare costs as the cohort of overweight and obese people ages, but it does mean that extrapolations need to be approached cautiously.
These particular extrapolations were made by a team including Professor Klim McPherson, who has appeared here before. At the end of 2009, he co-authored a report saying that obesity trends in England in children were levelling off, contradicting his earlier prediction for the 2007 Foresight Report that they were set to soar. In the Foresight Report of 2007, he forecast that 19 per cent of teenage boys would be obese by 2020; in 2009, that came down to 6 per cent. For girls, the 2020 predictions were reduced from 30 per cent obese in 2020 to 9 per cent.
More data is now available confirming the levelling trend, but yesterday he showed little sign of taking account of it. The Lancet’s press release asserts on his authority that by 2030 male obesity prevalence in the UK would, under existing trends, increase from 26 per cent (note: the true figure for England in 2009 was 22.1 per cent) to 41-48 per cent, and in women from 26 per cent to 35-43 per cent.
I wasn’t at the press conference, so I don’t know if Professor McPherson or his co-author, Dr Y Claire Wong of Columbia University, New York, were challenged by any of the journalists present. To judge from today’s cut-and-paste coverage, I doubt it.


Rob Lyons (not verified) wrote,
Fri, 26/08/2011 - 15:03
Nigel,
I was there and I did raise precisely these points. Claire Wang said (I think)
a) too early to tell, change in trend not clear
b) even if plateaued, still too high
c) may be a decline in middle-class kids but not more generally
but nothing in their work considers the possibility of a decline in rates which the HSE figures suggest must be a possibility going forward.
I'll listen to the audio to check.
Nigel Hawkes (not verified) wrote,
Sat, 27/08/2011 - 10:11
Many thanks, Rob. I'm delighted somebody challenged them
Anonymous (not verified) wrote,
Sat, 27/08/2011 - 19:01
It of course helps the HSE cause in that the first graph does not show a vertical axis descending to zero.
Rob Lyons (not verified) wrote,
Mon, 29/08/2011 - 20:06
Here's the excerpt from the press conference:
Me: In the figures in terms of projections for the future, you talked about the Health Survey for England and the latest kind of indicate a flattening out of things. If you look at the figures for children, there's a very distinct flattening out and if you look at the obesity rates among 2-15 year-olds, they're actually going down. I'd like your response in terms of the future there.
Boyd Swinburne: In relation to a potential flattening off and reductions, I think from several countries around the world, for children - not for adults - we are starting to see a flattening of that. It's 10 years since this first hit the front page basically and I think that is probably having an effect. It's like the early days of tobacco control, when that hit, that got us so far. They became aware and they did stuff but for tobacco we needed policies to embed that and to change the environment. In my view, the kids in some of these rich countries are the first to look like they're coming up but they're still at a very high level, it's not over.
(then some other questions)
Tam Fry (from the audience) makes a comment about levelling off not happening in all regions even if the overall figures are stabilising. Claims obesity rates in Richmond are 24% but in Westminster it is 40% (figures I can find from 2007-08 suggest the Westminster figure is actually about 24%).
(then some more questions)
Claire Wang: I just wanted to respond to the earlier point about trends. We're paying close attention to what the next two datapoints is going to tell us, but I think it's important to point out that flattening off by itself is not a point of celebration. So, in the United States, 17% of the teenagers are still obese. That's three times more than 20-30 years ago. We have not begun to realise the health extent of the effect of childhood obesity because it takes a long time frame. So, the interaction with the age structure is going to be very important. But more importantly, you pointed out, a lot of this flattening seems to be driven by a segment of the population that's better off. So in the United States, the non-Hispanic population and higher-income population tends to show the early signs of flattening or even reversing the childhood obesity levels, but the increasing disparity is something that is very important. How is the distribution of the disease burdens and cost burdens related to obesity-associated diseases... how does it effect the less-well-off and low income population?
Rob