Statistics pulls the plug on record pluggers
During his rise to fame – and before his taste for prostitutes caught up with him – New York State Governor Eliot Spitzer crossed swords with the record industry.
Recalling a word last heard in the 1950s, he charged them with “payola” - paying disc jockeys to play records with the aim of turning them into hits. Cynical New Yorkers were largely unmoved by Spitzer’s campaign, but he did persuade the big labels to desist, and even to pay cash in recompense.
Sony, for example, coughed up $10 million in 2005 and promised a “new, higher standard in radio promotion”, though without saying whether it had sacked any employees involved in the old, lower standard.
Proving payola isn’t easy, but a team of statisticians have devised a technique that might make it easier. Gabriel Rossman, Ming Ming Chiu and Joeri Mol used multilevel diffusion curves (MDC) to model the way new recordings find their way on to the US airwaves.
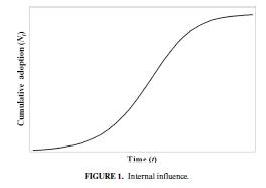
The technique has been around a while. In simple terms, an innovation that spreads by word of mouth between users typically starts slowly, followed by a period of accelerating growth which flattens as demand becomes satiated. This S-shaped curve is characteristic of many innovations spread by internal influence, such as the introduction of high-productivity hybrid corn in the US in the 1920s and 30s, encouraged by farmers talking to each other over the fence or at rural get-togethers.
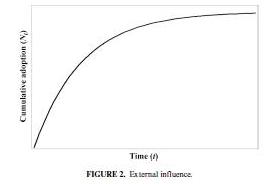
Innovations driven by external influence, such as the introduction of Equal Opportunity employment legislation in the US in the 1960s and 70s, follow an inverse exponential curve, fast at first then slowing. The introduction of antibiotics was a mixture of the two: doctors who read their medical journals followed the external pressure model and adopted the new drugs swiftly, while doctors who weren't quite so diligent were much slower to do so. For them (and their patients) the internal influence model predominated.
The internal influence curve looks like this:
And the external influence curve like this:
The shape of the curves provides a way of looking at the number of plays that records get on US radio. A disc relentlessly plugged or sold by means of bribes would be expected to show the external influence pattern, while one spreading on its own merits from DJ to DJ would show the internal influence. The team had added to the older research a better, cheaper and more flexible way of conducting the analysis, devised by Professor Ming Ming Chiu, now at the University at Buffalo.
They compared records identified by the Spitzer probe as having been driven by payola, and compared them with “control” records not named by Spitzer. The results show that the payola records did indeed achieve greater initial penetration of the airwaves, though not perhaps as dramatically as one might have wished.
They found that the Spitzer songs showed about 27 per cent more external influence than the control songs. This either means, they say, that payola has a weak effect in radio, or that the control songs were not really controls at all, but had themselves benefitted from payola, thus diminishing the difference found.
Dr Gabriel Rossman of the University of California at Los Angeles, the first author of the study, says payola is ever-present in the music industry. Even its name is old – it comes from a combination of “pay” and “Victrola” – an early type of radio made by RCA Victor. But it goes back even further than that, as sheet music publishers were known to offer bribes to music-hall performers.
Sad to say, the actual bribes paid by the song pluggers in the Spitzer case were in some cases frankly pitiful. DJs were given a single trainer, with the promise of a second for their other foot, if they played a particular disc. In one documented case, a radio station called KHTS-FM was given a $3,325 plasma screen TV in return for playing Shut Up by Kelly Osbourne, Pandemonium by B2K, and This is me ...then by Jennifer Lopez.
Sex, drugs and rock n’ roll? Not as Ian Dury knew it.
