Official Statistics: are the old cannier, or just more cynical?
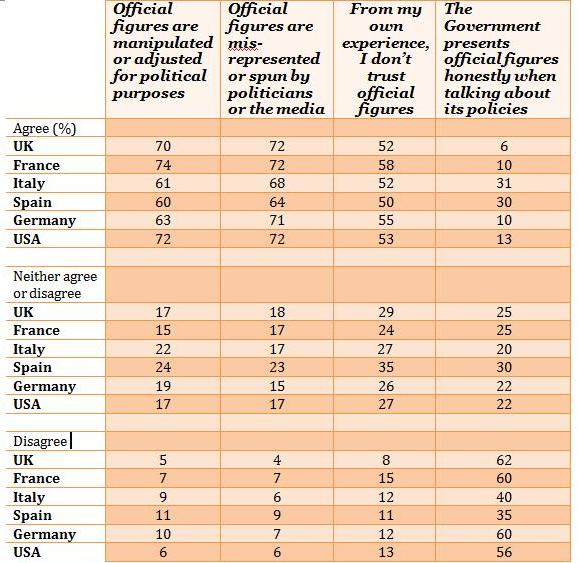
In December the Financial Times published a Harris survey of the public's confidence in national statistics across five European countries and the USA.
The article suggested that confidence was lower in the UK on more measures than in any other of the other counties, and much lower than figures published by the ONS in 2008, based on a survey taken in 2007.
Harris has kindly supplied Straight Statistics with the full data tables from the survey. Since they are likely to be of interest to readers, I have tabulated some of them here.
The first and most obvious conclusion is that the UK is not significantly different in its attitudes from the other five European countries, or from the US, as polled by Harris. Trust in official figures is lower in France and the US, for example.
Of the four questions tabulated below, the UK comes off worst only in the question about whether the Government presents official figures honestly when talking about its policies. The 6 per cent who agree with this statement in the UK is the lowest by some margin, probably reflecting a generalised disbelief in Governmental statements rather than specifically statistical ones.

But the striking impression is one of homogeneity rather than differences across these six countries. Only Italy and Spain buck the trend by showing slightly greater confidence in their governments’ honesty.
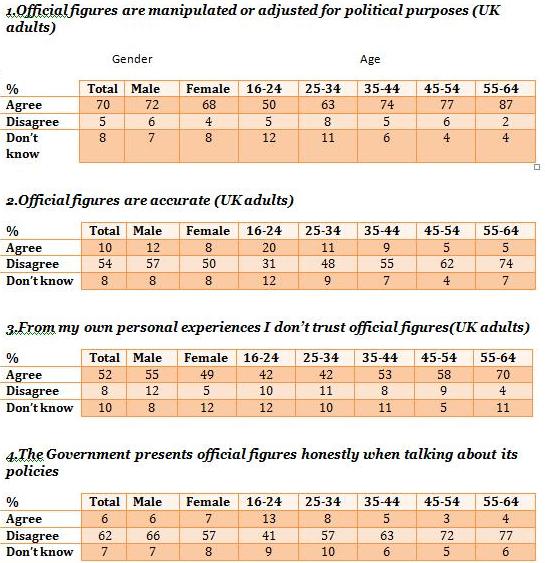
A more detailed breakdown of the UK responses by age is tabulated below. This shows a clear trend towards disbelief the older the respondent. In the 55-64 age group, for example, 87 per cent agreed that official figures are manipulated or adjusted for political purposes, compared to just 50 per cent of the 16 to 24 year olds.
The 55-64 age group were also the most likely to question the accuracy of UK statistics, showed the lowest levels of trust, and were least likely to believe that the Government presented official figures honestly. At issue here is whether this is simply a cynical generation and that overall trust will rise as it dies off, or whether all generations become more cynical with age. (It would have been interesting if Harris had also polled some over-65s.)

The poll also shows (in results not tabulated here) that those in higher income groups are more likely to believe the figures are manipulated, and to agree that they are not presented honestly by the Government. But they are more likely to believe that the figures themselves are accurate – 15 per cent of those in upper income groups believing this, against only 7 per cent in low income groups. However, most of this difference is accounted for by those who “tend to agree” so not too much should be made of it.
The Harris figures show lower confidence levels than did those of the last published survey by ONS, carried out in 2007 and published in March 2008. That had 37 per cent agreeing that official figures are generally accurate, against only 10 per cent for Harris, and 20 per cent agreeing that the figures are produced without political interference, against just 5 per cent for Harris.
These differences may have arisen from the way the questions were couched. Most of the Harris questions were neutral – for example: “Please tell us how much you agree or disagree with the following statements. Official figures are accurate”. This is much the same as the question the ONS survey asked: “Please tell me how strongly you agree or disagree with each statement. Official figures are generally accurate”.
But by asking respondents to agree or disagree with “Official figures are manipulated of adjusted for political purposes” Harris might be thought to have been leading the witness.
However, when both surveys asked people to agree or disagree with an identical proposition: “The Government presents official figures honestly when talking about its policies” 16 per cent of the ONS respondents either agreed or tended to agree, against only 6 per cent of Harris’s. That’s a big difference.
(Harris interviewed 1,000 respondents in each country. The European surveys were conducted between 2 and 11 December 2009, and the US survey between 2 and 7 December.)


