Tracking cultural change in a blizzard of words
Have you ever wondered about the rising popularity of a word? Take “iconic”, once a rarity, but now in daily use by broadcasters to describe anything slightly out of the ordinary.
Everything is iconic on the BBC today: the Harrier jump jet, the Boat Race, Joanna Lumley’s hairstyle, Dr Who, the Great North Run ... Other media are not blameless, either.
But measuring the rise of a word has not been easy. A simple Google search is confounded by the underlying growth of the internet, which means that virtually all words get more hits in recent periods than in earlier ones. But now a team at Harvard has come to the rescue, at least for books.
Working with Google, Encyclopaedia Britannica and the American Heritage Dictionary, they converted the text of 5.2 million books published over the past 500 years into a database of 500 billion words. At www.culturomics.org you can search this database for the frequency of word appearance between 1800 and 2000, choosing English, British English or American English, or a range of other languages – Chinese, French, Russian, German, Hebrew and Spanish.
Here’s what a search for “iconic” brings up, comparing its usage with that of “iconoclastic”. The Y-axis shows that of all words appearing in books, the percentage of them that are “iconic” – 0.0002 per cent by the year 2000. The data is smoothed, in this case by a factor of three, which means that each value for a given year is the average of three values of either side of the year selected, plus the year itself – that is, for example, the value for 1950 would be the average of the seven years from 1947 to 1953 inclusive.
![]()
Until the 1960s, iconoclastic was actually the commoner adjective, and then iconic began its rise. It’s a pity that the database available on the site ends at 2000, because since then the word has become ubiquitous. The creators, from the Cultural Observatory at Harvard, explain that since 2000 the content of the database has changed with the inception of the Google Books project, making comparison with the earlier period problematic.
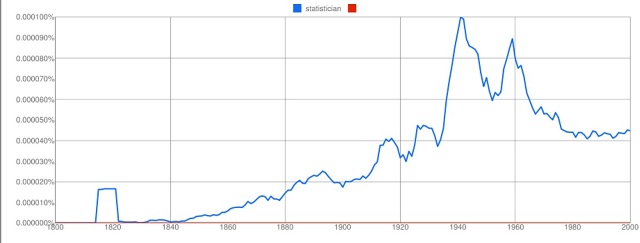
The site is endlessly amusing, and raises a few questions along the way. A search for the word “statistician” (below) shows a big rise during the 20th century, then a falling-off. But what accounts for the little hiccup around 1820? Clue: this doesn’t appear if you search in American English, and it may be an artefact, caused because fewer books were then published and a single appearance of the word in one might be enough to create a spike, turned into a plateau by the smoothing process.

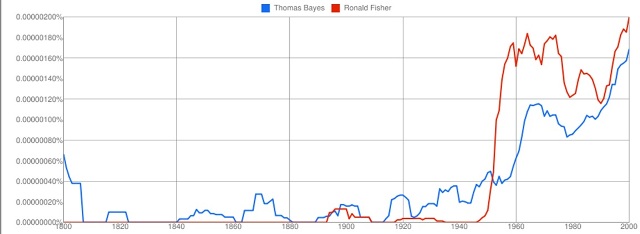
And comparing two “iconic” statisticians, Thomas Bayes and Ronald Fisher, shows roughly what one might expect, save for the fact that Fisher starts popping up in a minor way before he had even published the work that made him famous – maybe there was another Ronald Fisher who achieved modest fame around 1900, or maybe it’s an error in the digital scanning of books.
Fisher’s star really begins to rise at the time of his knighthood (1952) and the growth of Bayes’ reputation in recent years is shown by the rising frequency of mentions of his name after 1960, to rival Fisher in popularity by the end of the century.

Warning: this site can be a huge time-waster. But it’s a fascinating example of how a huge database, easily interrogated, can shed light on linguistic usage and change.
One of the team responsible, Erez Lieberman Aiden, told the FT: “While browsing this cultural record is fascinating for anyone interested in what’s mattered to people over time, we hope that scholars of the humanities and social sciences will find this to be a powerful tool.”


david (not verified) wrote,
Thu, 13/01/2011 - 10:11
Nigel
nice post
there is a very nice tool for summarising word frequencies within segments of text visually as word clouds, at http://www.wordle.net/ so if you created a series of word clouds at different time points you could demonstrate the sort of information in your charts above in a more interactive way through animation
regards
David